目录
在现代制造业和数据驱动的企业中,一个美观且功能强大的数据监控面板已经成为不可或缺的工具。如何用C#快速构建一个媲美Apple设计风格的实时监控系统?如何让复杂的工业数据以直观优雅的方式呈现?今天就来揭秘这套完整的解决方案。
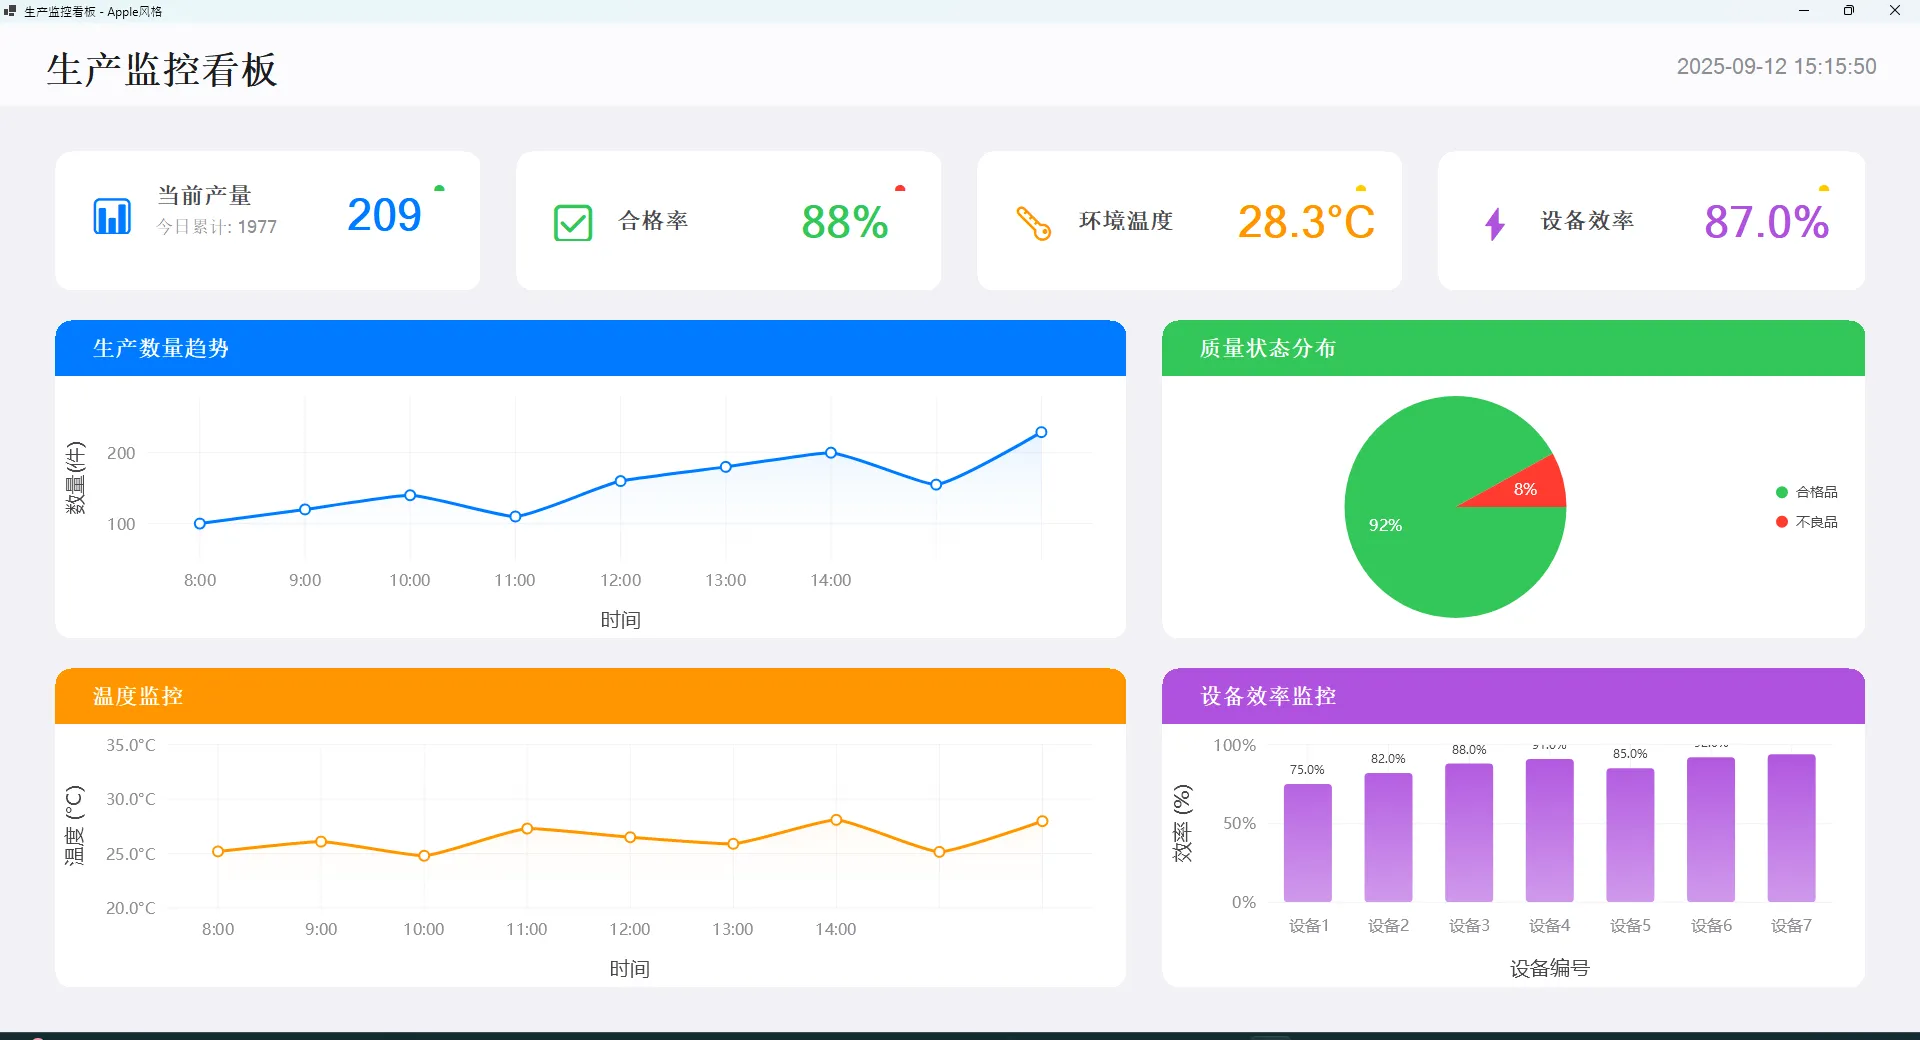
本文将带你构建一个完整的生产监控面板,涵盖实时数据更新、多种图表展示、Apple风格界面设计等核心技术,所有代码均可直接运行,适合工业物联网、企业监控、数据分析等实际应用场景。
🎯 为什么选择这套技术栈?
痛点分析
传统的C# WinForms应用往往面临以下问题:
- 界面古板:千篇一律的系统默认样式
- 图表功能弱:缺乏现代化的数据可视化能力
- 实时性差:数据更新机制不够灵活
- 用户体验差:缺乏流畅的交互效果
技术选型优势
我们的解决方案基于:
- LiveCharts Core:现代化图表库,支持多种图表类型
- SkiaSharp:跨平台2D图形引擎,性能卓越
- Apple设计语言:圆角、渐变、阴影等现代视觉效果
🔥 核心功能实现
1. Apple风格圆角设计
C#private void SetRoundedCorners(Control control, int radius)
{
    // 创建更精细的圆角路径
    var path = CreateRoundedRectanglePath(0, 0, control.Width, control.Height, radius);
    control.Region = new Region(path);

    // 为控件添加Paint事件以启用抗锯齿
    control.Paint += (sender, e) =>
    {
        e.Graphics.SmoothingMode = System.Drawing.Drawing2D.SmoothingMode.AntiAlias;
        e.Graphics.PixelOffsetMode = System.Drawing.Drawing2D.PixelOffsetMode.HighQuality;
    };
}

private System.Drawing.Drawing2D.GraphicsPath CreateRoundedRectanglePath(int x, int y, int width, int height, int radius)
{
    var path = new System.Drawing.Drawing2D.GraphicsPath();
    radius = Math.Min(radius, Math.Min(width / 2, height / 2));

    path.StartFigure();
    path.AddArc(x + width - radius * 2, y, radius * 2, radius * 2, 270, 90);
    path.AddArc(x + width - radius * 2, y + height - radius * 2, radius * 2, radius * 2, 0, 90);
    path.AddArc(x, y + height - radius * 2, radius * 2, radius * 2, 90, 90);
    path.AddArc(x, y, radius * 2, radius * 2, 180, 90);
    path.CloseFigure();

    return path;
}
🎨 设计亮点:
- 动态计算圆角半径,避免超出控件边界
- 启用抗锯齿和高质量像素偏移,确保视觉效果
- 支持任意控件的圆角化改造
2. 实时数据图表系统
C#private void InitializeCharts()
{
    var appleFont = SKTypeface.FromFamilyName("Microsoft YaHei");

    // 生产数量趋势图
    productionChart = new CartesianChart
    {
        Dock = DockStyle.Fill,
        BackColor = Color.White,
        TooltipTextPaint = new SolidColorPaint(SKColor.Parse("#1C1C1E"))
        {
            SKTypeface = appleFont,
            SKFontStyle = new SKFontStyle(SKFontStyleWeight.Normal, SKFontStyleWidth.Normal, SKFontStyleSlant.Upright)
        },
    };

    productionChart.Series = new ISeries[]
    {
        new LineSeries<double>
        {
            Name = "生产数量",
            Values = productionData,
            Stroke = new SolidColorPaint(SKColor.Parse("#007AFF")) { StrokeThickness = 3 },
            Fill = new LinearGradientPaint(
                new SKColor[] { SKColor.Parse("#007AFF").WithAlpha(40), SKColors.Transparent },
                new SKPoint(0, 0),
                new SKPoint(0, 1)),
            GeometryStroke = new SolidColorPaint(SKColor.Parse("#007AFF")) { StrokeThickness = 2 },
            GeometryFill = new SolidColorPaint(SKColors.White),
            GeometrySize = 10,
            LineSmoothness = 0.3 // 平滑曲线效果
        }
    };
}
📊 技术要点:
- 使用
LinearGradientPaint实现渐变填充效果 LineSmoothness参数控制曲线平滑度- Apple官方色彩体系(#007AFF系统蓝色)
3. 智能状态指示器
C#private void UpdateStatusIndicators()
{
    // Apple颜色系统
    var greenColor = Color.FromArgb(52, 199, 89);  // System Green
    var yellowColor = Color.FromArgb(255, 204, 0); // System Yellow
    var redColor = Color.FromArgb(255, 59, 48);     // System Red

    // 解析当前数据
    double currentEfficiency = double.Parse(lblEfficiency.Text.Replace("%", ""));
    double currentTemp = double.Parse(lblTemperature.Text.Replace("°C", ""));
    int currentQuality = int.Parse(lblQualityRate.Text.Replace("%", ""));

    // 生产状态智能判断
    statusIconProduction.Text = "●";
    statusIconProduction.ForeColor = currentProduction > 200 ? greenColor :
                                    currentProduction > 170 ? yellowColor : redColor;

    // 温度状态区间判断
    statusIconTemperature.Text = "●";
    statusIconTemperature.ForeColor = (currentTemp >= 24 && currentTemp <= 28) ? greenColor :
                                     (currentTemp >= 22 && currentTemp <= 30) ? yellowColor : redColor;
}
💡 实战技巧:
- 使用Apple官方颜色规范,确保视觉一致性
- 多级状态判断(正常/警告/异常),提升用户体验
- 简洁的圆点图标,符合现代设计趋势
4. 高性能实时数据更新
C#private void UpdateChartData()
{
    try
    {
        // 滑动窗口机制 - 控制数据量
        if (productionData.Count > 20)
        {
            productionData.RemoveAt(0); // 移除最旧数据
        }
        productionData.Add(random.Next(150, 250)); // 添加新数据

        // 动态更新饼图数据
        int newQualityRate = random.Next(88, 97);
        qualityGoodData[0] = newQualityRate;
        qualityBadData[0] = 100 - newQualityRate;

        // 设备效率随机更新
        int deviceIndex = random.Next(0, efficiencyData.Count);
        efficiencyData[deviceIndex] = random.Next(75, 95);
    }
    catch (Exception ex)
    {
        Console.WriteLine($"更新图表数据时出错: {ex.Message}");
    }
}
⚡ 性能优化要点:
- 滑动窗口机制:限制内存中数据点数量,避免内存泄漏
- 异常处理:确保数据更新异常不影响整体运行
- 局部更新:只更新变化的数据项,提升效率
🛠️ 项目部署指南
NuGet包依赖
XML<PackageReference Include="LiveChartsCore.SkiaSharpView.WinForms" Version="2.0.0-rc2" />
<PackageReference Include="SkiaSharp" Version="2.88.0" />
<PackageReference Include="System.Text.Encoding.CodePages" Version="7.0.0" />
关键配置
C#public Form1()
{
    // 注册编码提供程序 - 解决中文显示问题
    Encoding.RegisterProvider(CodePagesEncodingProvider.Instance);

    InitializeComponent();
    InitializeData();
    InitializeCharts();
    InitializeTimer();

    // 应用Apple风格效果
    AppleStyleEffects();
}
🤪 完整代码
C#using LiveChartsCore;
using LiveChartsCore.SkiaSharpView;
using LiveChartsCore.SkiaSharpView.WinForms;
using LiveChartsCore.SkiaSharpView.Painting;
using SkiaSharp;
using System.Collections.ObjectModel;
using System.Text;
using Timer = System.Windows.Forms.Timer;
namespace AppProductionMonitoringDashboard
{
public partial class Form1 : Form
{
private Timer updateTimer;
private Random random = new Random();
// LiveCharts控件
private CartesianChart productionChart;
private PieChart qualityChart;
private CartesianChart temperatureChart;
private CartesianChart efficiencyChart;
// 数据集合
private ObservableCollection<double> productionData;
private ObservableCollection<double> temperatureData;
private ObservableCollection<double> efficiencyData;
private ObservableCollection<double> qualityGoodData;
private ObservableCollection<double> qualityBadData;
public Form1()
{
Encoding.RegisterProvider(CodePagesEncodingProvider.Instance);
InitializeComponent();
InitializeData();
InitializeCharts();
InitializeTimer();
UpdateRealTimeData();
// 添加圆角和阴影效果
AppleStyleEffects();
}
private void AppleStyleEffects()
{
// 为卡片添加圆角效果
SetRoundedCorners(cardProduction, 16);
SetRoundedCorners(cardQuality, 16);
SetRoundedCorners(cardTemperature, 16);
SetRoundedCorners(cardEfficiency, 16);
SetRoundedCorners(panelProduction, 16);
SetRoundedCorners(panelQuality, 16);
SetRoundedCorners(panelTemperature, 16);
SetRoundedCorners(panelEfficiency, 16);
}
private void SetRoundedCorners(Control control, int radius)
{
// 创建更精细的圆角路径
var path = CreateRoundedRectanglePath(0, 0, control.Width, control.Height, radius);
control.Region = new Region(path);
// 为控件添加Paint事件以启用抗锯齿
control.Paint += (sender, e) =>
{
e.Graphics.SmoothingMode = System.Drawing.Drawing2D.SmoothingMode.AntiAlias;
e.Graphics.PixelOffsetMode = System.Drawing.Drawing2D.PixelOffsetMode.HighQuality;
};
}
private System.Drawing.Drawing2D.GraphicsPath CreateRoundedRectanglePath(int x, int y, int width, int height, int radius)
{
var path = new System.Drawing.Drawing2D.GraphicsPath();
radius = Math.Min(radius, Math.Min(width / 2, height / 2));
path.StartFigure();
path.AddArc(x + width - radius * 2, y, radius * 2, radius * 2, 270, 90);
path.AddArc(x + width - radius * 2, y + height - radius * 2, radius * 2, radius * 2, 0, 90);
path.AddArc(x, y + height - radius * 2, radius * 2, radius * 2, 90, 90);
path.AddArc(x, y, radius * 2, radius * 2, 180, 90);
path.CloseFigure();
return path;
}
private void InitializeData()
{
productionData = new ObservableCollection<double> { 100, 120, 140, 110, 160, 180, 200 };
temperatureData = new ObservableCollection<double> { 25.2, 26.1, 24.8, 27.3, 26.5, 25.9, 28.1 };
efficiencyData = new ObservableCollection<double> { 75, 82, 88, 90, 85, 92, 88 };
qualityGoodData = new ObservableCollection<double> { 85 };
qualityBadData = new ObservableCollection<double> { 15 };
}
private void InitializeCharts()
{
var appleFont = SKTypeface.FromFamilyName("Microsoft YaHei");
// 生产数量图表
productionChart = new CartesianChart
{
Dock = DockStyle.Fill,
BackColor = Color.White,
TooltipTextPaint = new SolidColorPaint(SKColor.Parse("#1C1C1E"))
{
SKTypeface = appleFont,
SKFontStyle = new SKFontStyle(SKFontStyleWeight.Normal, SKFontStyleWidth.Normal, SKFontStyleSlant.Upright)
},
};
productionChart.Series = new ISeries[]
{
new LineSeries<double>
{
Name = "生产数量",
Values = productionData,
Stroke = new SolidColorPaint(SKColor.Parse("#007AFF")) { StrokeThickness = 3 },
Fill = new LinearGradientPaint(
new SKColor[] { SKColor.Parse("#007AFF").WithAlpha(40), SKColors.Transparent },
new SKPoint(0, 0),
new SKPoint(0, 1)),
GeometryStroke = new SolidColorPaint(SKColor.Parse("#007AFF")) { StrokeThickness = 2 },
GeometryFill = new SolidColorPaint(SKColors.White),
GeometrySize = 10,
LineSmoothness = 0.3
}
};
productionChart.XAxes = new Axis[]
{
new Axis
{
Name = "时间",
Labels = new[] { "8:00", "9:00", "10:00", "11:00", "12:00", "13:00", "14:00" },
NamePaint = new SolidColorPaint(SKColor.Parse("#48484A"))
{
SKTypeface = appleFont,
SKFontStyle = new SKFontStyle(SKFontStyleWeight.Normal, SKFontStyleWidth.Normal, SKFontStyleSlant.Upright)
},
LabelsPaint = new SolidColorPaint(SKColor.Parse("#8E8E93"))
{
SKTypeface = appleFont,
SKFontStyle = new SKFontStyle(SKFontStyleWeight.Normal, SKFontStyleWidth.Normal, SKFontStyleSlant.Upright)
},
SeparatorsPaint = new SolidColorPaint(SKColor.Parse("#F2F2F7")) { StrokeThickness = 1 }
}
};
productionChart.YAxes = new Axis[]
{
new Axis
{
Name = "数量(件)",
NamePaint = new SolidColorPaint(SKColor.Parse("#48484A"))
{
SKTypeface = appleFont,
SKFontStyle = new SKFontStyle(SKFontStyleWeight.Normal, SKFontStyleWidth.Normal, SKFontStyleSlant.Upright)
},
LabelsPaint = new SolidColorPaint(SKColor.Parse("#8E8E93"))
{
SKTypeface = appleFont,
SKFontStyle = new SKFontStyle(SKFontStyleWeight.Normal, SKFontStyleWidth.Normal, SKFontStyleSlant.Upright)
},
SeparatorsPaint = new SolidColorPaint(SKColor.Parse("#F2F2F7")) { StrokeThickness = 1 }
}
};
panelProductionChart.Controls.Add(productionChart);
// 质量状态饼图
qualityChart = new PieChart
{
Dock = DockStyle.Fill,
BackColor = Color.White,
LegendTextPaint = new SolidColorPaint(SKColor.Parse("#48484A"))
{
SKTypeface = appleFont,
SKFontStyle = new SKFontStyle(SKFontStyleWeight.Normal, SKFontStyleWidth.Normal, SKFontStyleSlant.Upright)
},
LegendTextSize = 14,
LegendPosition = LiveChartsCore.Measure.LegendPosition.Right,
TooltipTextPaint = new SolidColorPaint(SKColor.Parse("#1C1C1E"))
{
SKTypeface = appleFont,
SKFontStyle = new SKFontStyle(SKFontStyleWeight.Normal, SKFontStyleWidth.Normal, SKFontStyleSlant.Upright)
},
};
qualityChart.Series = new ISeries[]
{
new PieSeries<double>
{
Name = "合格品",
Values = qualityGoodData,
Fill = new SolidColorPaint(SKColor.Parse("#34C759")),
DataLabelsPaint = new SolidColorPaint(SKColors.White)
{
SKTypeface = appleFont,
SKFontStyle = new SKFontStyle(SKFontStyleWeight.Bold, SKFontStyleWidth.Normal, SKFontStyleSlant.Upright)
},
DataLabelsSize = 16,
DataLabelsPosition = LiveChartsCore.Measure.PolarLabelsPosition.Middle,
DataLabelsFormatter = point => $"{point.PrimaryValue}%"
},
new PieSeries<double>
{
Name = "不良品",
Values = qualityBadData,
Fill = new SolidColorPaint(SKColor.Parse("#FF3B30")),
DataLabelsPaint = new SolidColorPaint(SKColors.White)
{
SKTypeface = appleFont,
SKFontStyle = new SKFontStyle(SKFontStyleWeight.Bold, SKFontStyleWidth.Normal, SKFontStyleSlant.Upright)
},
DataLabelsSize = 16,
DataLabelsPosition = LiveChartsCore.Measure.PolarLabelsPosition.Middle,
DataLabelsFormatter = point => $"{point.PrimaryValue}%"
}
};
panelQualityChart.Controls.Add(qualityChart);
// 温度监控图表
temperatureChart = new CartesianChart
{
Dock = DockStyle.Fill,
BackColor = Color.White,
TooltipTextPaint = new SolidColorPaint(SKColor.Parse("#1C1C1E"))
{
SKTypeface = appleFont,
SKFontStyle = new SKFontStyle(SKFontStyleWeight.Normal, SKFontStyleWidth.Normal, SKFontStyleSlant.Upright)
},
};
temperatureChart.Series = new ISeries[]
{
new LineSeries<double>
{
Name = "环境温度",
Values = temperatureData,
Stroke = new SolidColorPaint(SKColor.Parse("#FF9500")) { StrokeThickness = 3 },
Fill = new LinearGradientPaint(
new SKColor[] { SKColor.Parse("#FF9500").WithAlpha(40), SKColors.Transparent },
new SKPoint(0, 0),
new SKPoint(0, 1)),
GeometryStroke = new SolidColorPaint(SKColor.Parse("#FF9500")) { StrokeThickness = 2 },
GeometryFill = new SolidColorPaint(SKColors.White),
GeometrySize = 10,
LineSmoothness = 0.3
}
};
temperatureChart.XAxes = new Axis[]
{
new Axis
{
Name = "时间",
Labels = new[] { "8:00", "9:00", "10:00", "11:00", "12:00", "13:00", "14:00" },
NamePaint = new SolidColorPaint(SKColor.Parse("#48484A"))
{
SKTypeface = appleFont,
SKFontStyle = new SKFontStyle(SKFontStyleWeight.Normal, SKFontStyleWidth.Normal, SKFontStyleSlant.Upright)
},
LabelsPaint = new SolidColorPaint(SKColor.Parse("#8E8E93"))
{
SKTypeface = appleFont,
SKFontStyle = new SKFontStyle(SKFontStyleWeight.Normal, SKFontStyleWidth.Normal, SKFontStyleSlant.Upright)
},
SeparatorsPaint = new SolidColorPaint(SKColor.Parse("#F2F2F7")) { StrokeThickness = 1 }
}
};
temperatureChart.YAxes = new Axis[]
{
new Axis
{
Name = "温度 (°C)",
NamePaint = new SolidColorPaint(SKColor.Parse("#48484A"))
{
SKTypeface = appleFont,
SKFontStyle = new SKFontStyle(SKFontStyleWeight.Normal, SKFontStyleWidth.Normal, SKFontStyleSlant.Upright)
},
LabelsPaint = new SolidColorPaint(SKColor.Parse("#8E8E93"))
{
SKTypeface = appleFont,
SKFontStyle = new SKFontStyle(SKFontStyleWeight.Normal, SKFontStyleWidth.Normal, SKFontStyleSlant.Upright)
},
MinLimit = 20,
MaxLimit = 35,
Labeler = value => $"{value:F1}°C",
SeparatorsPaint = new SolidColorPaint(SKColor.Parse("#F2F2F7")) { StrokeThickness = 1 }
}
};
panelTemperatureChart.Controls.Add(temperatureChart);
// 效率图表
efficiencyChart = new CartesianChart
{
Dock = DockStyle.Fill,
BackColor = Color.White,
TooltipTextPaint = new SolidColorPaint(SKColor.Parse("#1C1C1E"))
{
SKTypeface = appleFont,
SKFontStyle = new SKFontStyle(SKFontStyleWeight.Normal, SKFontStyleWidth.Normal, SKFontStyleSlant.Upright)
},
};
efficiencyChart.Series = new ISeries[]
{
new ColumnSeries<double>
{
Name = "设备效率",
Values = efficiencyData,
Fill = new LinearGradientPaint(
new SKColor[] { SKColor.Parse("#AF52DE"), SKColor.Parse("#AF52DE").WithAlpha(150) },
new SKPoint(0, 0),
new SKPoint(0, 1)),
DataLabelsPaint = new SolidColorPaint(SKColor.Parse("#48484A"))
{
SKTypeface = appleFont,
SKFontStyle = new SKFontStyle(SKFontStyleWeight.Normal, SKFontStyleWidth.Normal, SKFontStyleSlant.Upright)
},
DataLabelsSize = 12,
DataLabelsPosition = LiveChartsCore.Measure.DataLabelsPosition.Top,
DataLabelsFormatter = point => $"{point.PrimaryValue:F1}%",
Rx = 4,
Ry = 4
}
};
efficiencyChart.XAxes = new Axis[]
{
new Axis
{
Name = "设备编号",
Labels = new[] { "设备1", "设备2", "设备3", "设备4", "设备5", "设备6", "设备7" },
NamePaint = new SolidColorPaint(SKColor.Parse("#48484A"))
{
SKTypeface = appleFont,
SKFontStyle = new SKFontStyle(SKFontStyleWeight.Normal, SKFontStyleWidth.Normal, SKFontStyleSlant.Upright)
},
LabelsPaint = new SolidColorPaint(SKColor.Parse("#8E8E93"))
{
SKTypeface = appleFont,
SKFontStyle = new SKFontStyle(SKFontStyleWeight.Normal, SKFontStyleWidth.Normal, SKFontStyleSlant.Upright)
},
SeparatorsPaint = new SolidColorPaint(SKColor.Parse("#F2F2F7")) { StrokeThickness = 1 }
}
};
efficiencyChart.YAxes = new Axis[]
{
new Axis
{
Name = "效率 (%)",
NamePaint = new SolidColorPaint(SKColor.Parse("#48484A"))
{
SKTypeface = appleFont,
SKFontStyle = new SKFontStyle(SKFontStyleWeight.Normal, SKFontStyleWidth.Normal, SKFontStyleSlant.Upright)
},
LabelsPaint = new SolidColorPaint(SKColor.Parse("#8E8E93"))
{
SKTypeface = appleFont,
SKFontStyle = new SKFontStyle(SKFontStyleWeight.Normal, SKFontStyleWidth.Normal, SKFontStyleSlant.Upright)
},
MinLimit = 0,
MaxLimit = 100,
Labeler = value => $"{value:F0}%",
SeparatorsPaint = new SolidColorPaint(SKColor.Parse("#F2F2F7")) { StrokeThickness = 1 }
}
};
panelEfficiencyChart.Controls.Add(efficiencyChart);
}
private void InitializeTimer()
{
updateTimer = new Timer();
updateTimer.Interval = 3000; // 3秒更新一次
updateTimer.Tick += UpdateTimer_Tick;
updateTimer.Start();
}
private void UpdateTimer_Tick(object sender, EventArgs e)
{
UpdateRealTimeData();
}
private void UpdateRealTimeData()
{
// 更新实时数据显示
lblCurrentTime.Text = DateTime.Now.ToString("yyyy-MM-dd HH:mm:ss");
// 模拟实时数据
int currentProduction = random.Next(150, 250);
int totalProduction = random.Next(1800, 2200);
double efficiency = random.Next(80, 95);
double temperature = random.Next(23, 30) + random.NextDouble();
int qualityRate = random.Next(88, 97);
lblCurrentProduction.Text = currentProduction.ToString();
lblTotalProduction.Text = $"今日累计: {totalProduction}";
lblEfficiency.Text = efficiency.ToString("F1") + "%";
lblTemperature.Text = temperature.ToString("F1") + "°C";
lblQualityRate.Text = qualityRate.ToString() + "%";
// 更新状态指示器
UpdateStatusIndicators();
// 更新图表数据
UpdateChartData();
}
private void UpdateStatusIndicators()
{
// 解析当前数据来决定状态颜色 - 使用Apple颜色系统
double currentEfficiency = double.Parse(lblEfficiency.Text.Replace("%", ""));
double currentTemp = double.Parse(lblTemperature.Text.Replace("°C", ""));
int currentQuality = int.Parse(lblQualityRate.Text.Replace("%", ""));
int currentProd = int.Parse(lblCurrentProduction.Text);
// Apple颜色系统
var greenColor = Color.FromArgb(52, 199, 89); // System Green
var yellowColor = Color.FromArgb(255, 204, 0); // System Yellow
var redColor = Color.FromArgb(255, 59, 48); // System Red
// 生产状态
statusIconProduction.Text = "●";
statusIconProduction.ForeColor = currentProd > 200 ? greenColor :
currentProd > 170 ? yellowColor : redColor;
// 质量状态
statusIconQuality.Text = "●";
statusIconQuality.ForeColor = currentQuality >= 95 ? greenColor :
currentQuality >= 90 ? yellowColor : redColor;
// 温度状态
statusIconTemperature.Text = "●";
statusIconTemperature.ForeColor = (currentTemp >= 24 && currentTemp <= 28) ? greenColor :
(currentTemp >= 22 && currentTemp <= 30) ? yellowColor : redColor;
// 效率状态
statusIconEfficiency.Text = "●";
statusIconEfficiency.ForeColor = currentEfficiency >= 90 ? greenColor :
currentEfficiency >= 80 ? yellowColor : redColor;
}
private void UpdateChartData()
{
try
{
// 更新生产数量图表
if (productionData.Count > 20)
{
productionData.RemoveAt(0);
}
productionData.Add(random.Next(150, 250));
// 更新质量饼图
int newQualityRate = random.Next(88, 97);
qualityGoodData[0] = newQualityRate;
qualityBadData[0] = 100 - newQualityRate;
// 更新温度图表
if (temperatureData.Count > 20)
{
temperatureData.RemoveAt(0);
}
temperatureData.Add(random.Next(23, 30) + random.NextDouble());
// 更新效率图表
int deviceIndex = random.Next(0, efficiencyData.Count);
efficiencyData[deviceIndex] = random.Next(75, 95);
}
catch (Exception ex)
{
Console.WriteLine($"更新图表数据时出错: {ex.Message}");
}
}
protected override void OnFormClosed(FormClosedEventArgs e)
{
updateTimer?.Stop();
updateTimer?.Dispose();
base.OnFormClosed(e);
}
protected override void OnResize(EventArgs e)
{
base.OnResize(e);
// 重新应用圆角效果
AppleStyleEffects();
}
}
}
⚠️ 常见问题与解决方案
1. 中文字体显示异常
问题:图表中文标签显示为方框
解决:注册编码提供程序 + 指定中文字体
C#Encoding.RegisterProvider(CodePagesEncodingProvider.Instance); //可以不用
var appleFont = SKTypeface.FromFamilyName("Microsoft YaHei");
2. 圆角在窗口缩放后失效
问题:窗口大小改变后圆角消失
解决:重写OnResize事件
C#protected override void OnResize(EventArgs e)
{
    base.OnResize(e);
    AppleStyleEffects(); // 重新应用圆角效果
}
3. Timer资源泄漏
问题:应用关闭后Timer仍在运行
解决:正确处置Timer资源
C#protected override void OnFormClosed(FormClosedEventArgs e)
{
    updateTimer?.Stop();
    updateTimer?.Dispose();
    base.OnFormClosed(e);
}
🎨 实际应用场景
工业制造监控
- 生产线状态监控:实时显示各条生产线的产量、效率
- 设备健康管理:温度、压力、转速等关键参数监控
- 质量控制看板:合格率、次品率实时统计
企业数据面板
- 销售业绩监控:各区域、各产品线销售数据
- 服务器性能监控:CPU、内存、网络流量等指标
- 用户行为分析:网站访问量、用户活跃度等
物联网应用
- 智慧城市监控:交通流量、环境质量监测
- 智能家居面板:能耗监控、安全状态显示
- 农业监控系统:土壤湿度、温室环境监控
📈 扩展功能建议
数据持久化
C#// 集成SQLite或SQL Server存储历史数据
public void SaveHistoricalData()
{
    // 实现数据保存逻辑
}
报警机制
C#// 添加阈值监控和报警功能
public void CheckThresholds()
{
    if (temperature > warningThreshold)
    {
        // 触发报警通知
        SendAlert("温度异常");
    }
}
网络数据源
C#// 集成HTTP API或WebSocket实现真实数据源
public async Task FetchRealTimeData()
{
    // 从API获取真实数据
}
💭 技术思考与展望
这套监控面板系统展现了现代C# WinForms开发的三大趋势:
- 视觉现代化:告别传统Windows控件的古板外观,拥抱现代设计语言
- 数据可视化:借助优秀的第三方图表库,快速实现专业级数据展示
- 实时交互:通过Timer和数据绑定机制,实现流畅的实时更新体验
未来可以考虑集成更多现代化技术:
- WebView2控件:集成Web技术实现更复杂的交互
- SignalR:实现多客户端实时数据同步
- **Machine **Learning.NET:添加数据预测和异常检测能力
🎯 核心要点总结:
- Apple风格设计:圆角、渐变、阴影打造现代化界面
- LiveCharts集成:快速实现专业级图表功能
- 实时数据机制:Timer + ObservableCollection实现流畅更新
你在实际项目中是否也遇到过界面美观性和数据实时性的挑战?欢迎在评论区分享你的监控面板开发经验,或者遇到的技术难题!
觉得这套方案对你有帮助?请转发给更多需要提升C#应用界面品质的同行! 让我们一起推动.NET桌面应用的现代化进程!
相关信息
通过网盘分享的文件:AppProductionMonitoringDashboard.zip 链接: https://pan.baidu.com/s/15u6MMIfVqrux6EMGx1EEYQ?pwd=nrr6 提取码: nrr6 --来自百度网盘超级会员v9的分享
本文作者:技术老小子
本文链接:
版权声明:本博客所有文章除特别声明外,均采用 BY-NC-SA 许可协议。转载请注明出处!
目录