目录
摘要
LiveCharts2 Gauge仪表盘是一种常用的仪表盘类型,它可以显示某个值与最大值之间的百分比,让用户更直观地了解数据的变化情况。
仪表盘一般应用于工业自动化领域,例如机器人、自动化生产线等。它可以监控设备的运行状态,提供实时数据,以及进行远程控制。在现代工业生产中,仪表盘的作用越来越重要,可以帮助工厂实现高效率、高质量的生产,并且能够快速发现问题并进行解决。此外,仪表盘还可以应用于交通运输领域,例如航空航天、船舶等,用于监控设备的运行状态和数据分析。
仪表盘的基本构成包括指针、数字、图标、颜色等元素,它们可以清晰地显示设备的运行状态和数据,帮助用户快速了解设备的工作状态。此外,仪表盘还可以提供数据分析功能,用于分析设备的运行状况和数据趋势,为工厂提供更好的决策支持。
正文
.net 6下需要单独安装
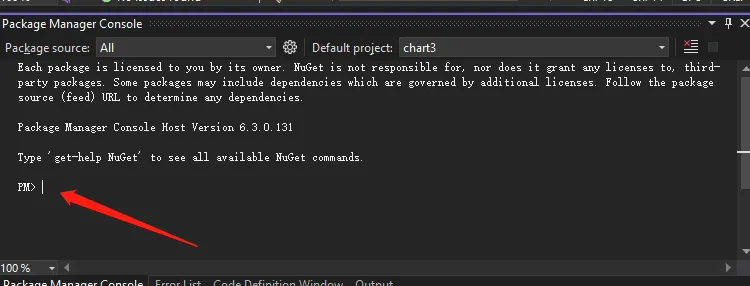
现在最新版本通过Nuget命令安装
https://www.nuget.org/packages/LiveChartsCore.SkiaSharpView.WinForms 下载最新的版本
NuGet\Install-Package LiveChartsCore.SkiaSharpView.WinForms -Version 2.0.0-beta.860
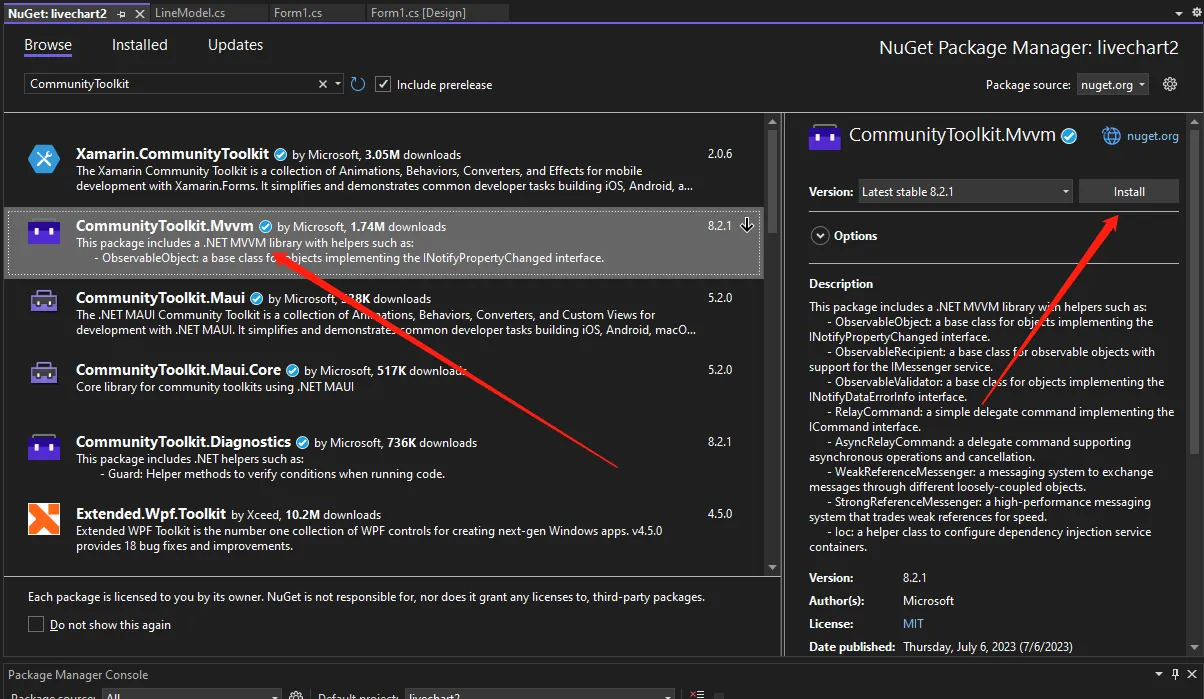
安装CommunityToolkit.Mvvm.ComponentModel
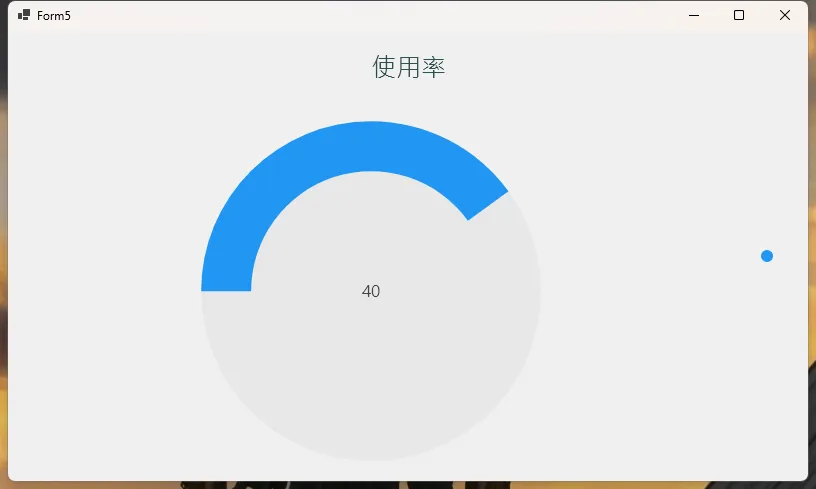
liveChart2下的仪表盘,其实就是PieChart下的环。
来个最基本的
这里注意一个类GaugeBuilder,构建仪表盘用
PieChart的Total是指最大数
C#public class GaugeModel : ObservableObject
{
    public IEnumerable<ISeries> Series { get; set; } =
        new GaugeBuilder().WithMaxColumnWidth(50)
            .AddValue(40)
            .BuildSeries();

    public LabelVisual Title { get; set; } =
    new LabelVisual
     {
         Text = "使用率",
         TextSize = 25,
         Padding = new LiveChartsCore.Drawing.Padding(15),
         Paint = new SolidColorPaint(SKColors.DarkSlateGray)
     };


}
C#public partial class Form5 : Form
{
    private  PieChart pieChart;
    GaugeModel model = new GaugeModel();
    public Form5()
    {
        InitializeComponent();
        //配制全局中文显示,不然会乱码
        LiveCharts.Configure(x =>
        {
            x.HasGlobalSKTypeface(SKFontManager.Default.MatchCharacter('汉'));
        });
        Init();
    }
    public void Init()
    {
        pieChart = new PieChart
        {
            Total = 100,//总共多大
            InitialRotation=180,//起始位置
            Series = model.Series,
            Title = model.Title,
            LegendPosition = LiveChartsCore.Measure.LegendPosition.Right,
        };

        this.Controls.Add(pieChart);
        pieChart.Dock = DockStyle.Fill;
    }
}
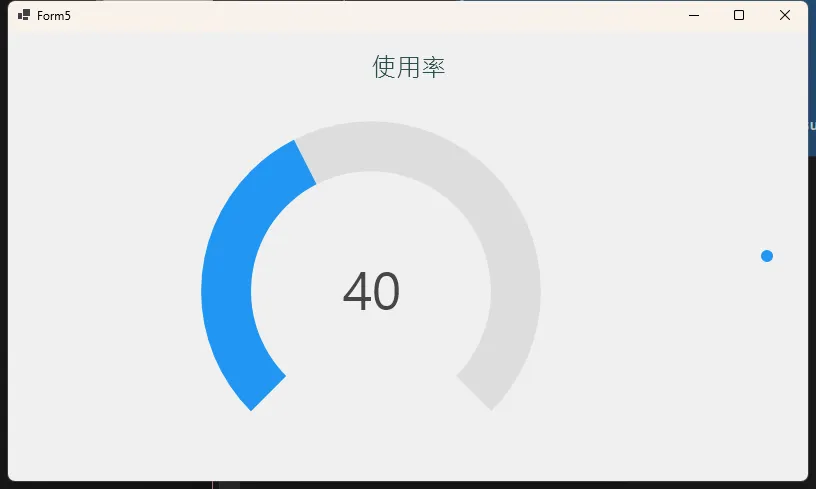
修改Series参数
C# public IEnumerable<ISeries> Series { get; set; } =
     new GaugeBuilder()
     .WithInnerRadius(120)
     .WithBackgroundInnerRadius(120)//内部环
     .WithBackground(new SolidColorPaint(SKColor.Parse("#dddddd")))
     .WithLabelsSize(50)//环中字体大小
     .AddValue(40)
     .BuildSeries();
这里需要配制
MaxAngle 这个表示不是一个环,带缺口了
InitialRotation = -225,//起始位置 MaxAngle = 270,
C#pieChart = new PieChart
{
    Total = 100,//总共多大
    InitialRotation = -225,//起始位置
    MaxAngle = 270,
    Series = model.Series,
    Title = model.Title,
    LegendPosition = LiveChartsCore.Measure.LegendPosition.Right,
};
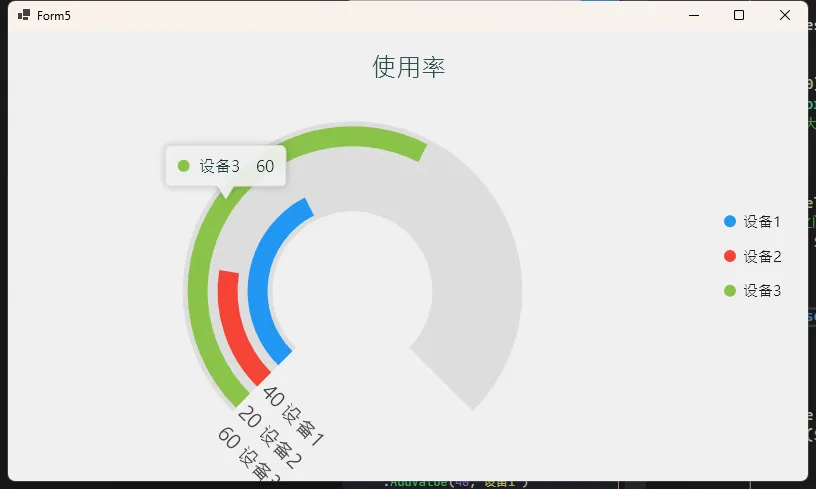
多环嵌套
C#public IEnumerable<ISeries> Series { get; set; } =
    new GaugeBuilder()
    .WithInnerRadius(80)
    .WithBackgroundInnerRadius(80)//内部环
    .WithBackground(new SolidColorPaint(SKColor.Parse("#dddddd")))
    .WithLabelsSize(20)//环中字体大小
    .AddValue(40,"设备1")
    .AddValue(20, "设备2")
    .AddValue(60, "设备3")
    .WithLabelsPosition(PolarLabelsPosition.Start)//字显示的位置
    .WithOffsetRadius(5)//每个环之间的间隙
    .WithLabelFormatter(point => $"{point.Coordinate.PrimaryValue} {point.Context.Series.Name}")
    .BuildSeries();
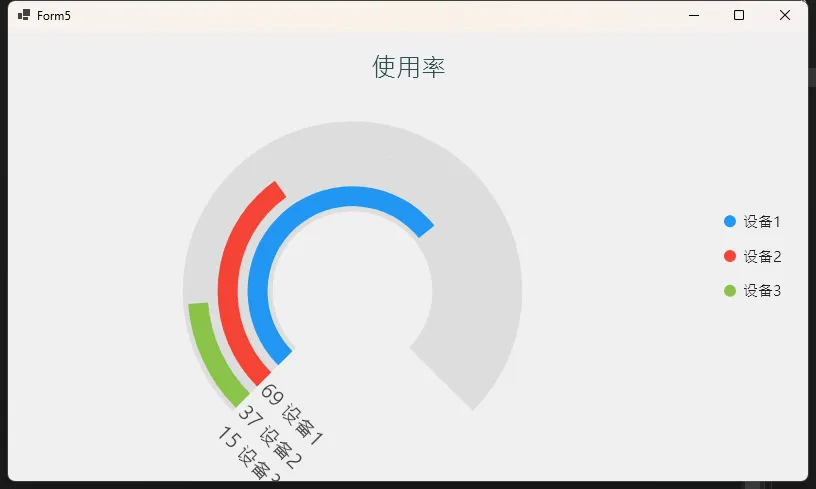
动态刷新
C#public class GaugeModel : ObservableObject
{
    private Random _random = new Random();

    public GaugeModel()
    {

    }

    public IEnumerable<ISeries> Series { get; set; }

    public LabelVisual Title { get; set; } =
     new LabelVisual
     {
         Text = "使用率",
         TextSize = 25,
         Padding = new LiveChartsCore.Drawing.Padding(15),
         Paint = new SolidColorPaint(SKColors.DarkSlateGray)
     };

    public void RandomChange()
    {
        int Eq1 = _random.Next(1, 100);
        int Eq2 = _random.Next(1, 100);
        int Eq3 = _random.Next(1, 100);
        Series = new GaugeBuilder()
        .WithInnerRadius(80)
        .WithBackgroundInnerRadius(80)//内部环
        .WithBackground(new SolidColorPaint(SKColor.Parse("#dddddd")))
        .WithLabelsSize(20)//环中字体大小
        .AddValue(Eq1, "设备1")
        .AddValue(Eq2, "设备2")
        .AddValue(Eq3, "设备3")
        .WithLabelsPosition(PolarLabelsPosition.Start)//字显示的位置
        .WithOffsetRadius(5)//每个环之间的间隙
        .WithLabelFormatter(point => $"{point.Coordinate.PrimaryValue} {point.Context.Series.Name}")
        .BuildSeries();
    }
}
C#public void Init()
{
    pieChart = new PieChart
    {
        Total = 100,//总共多大
        InitialRotation = -225,//起始位置
        MaxAngle=270,
        Series = model.Series,
        Title = model.Title,
        LegendPosition = LiveChartsCore.Measure.LegendPosition.Right,
    };
    this.Controls.Add(pieChart);
    pieChart.Dock = DockStyle.Fill;
    UpdateValue();
}

private async void UpdateValue()
{
    while (true)
    {
        model.RandomChange();
        pieChart.Series=model.Series;
        await Task.Delay(3000);
    }
}
本文作者:技术老小子
本文链接:
版权声明:本博客所有文章除特别声明外,均采用 BY-NC-SA 许可协议。转载请注明出处!
目录