
目录
🏭 你是不是也遇到过这种情况?
车间里的 PLC 跑得好好的,数据全在里头——但就是没法方便地"拿出来"看。工程师盯着触摸屏,想把实时数据搬到电脑上做分析,翻遍网络,要么是昂贵的 SCADA 软件,要么是晦涩的工业协议文档。折腾半天,脑壳疼。
我在一个离散制造的项目里就踩过这个坑。当时需要把西门子 S7-1200 的温度和压力数据实时展示在操作站的 Windows 电脑上,预算有限,时间紧。最后用 Python + Tkinter + snap7 库,三天搞定了一个能用的监控小工具——不依赖任何商业授权,代码不超过 300 行。
这篇文章就把这套思路完整拆给你看。读完之后,你能拿到:一个可直接运行的 Tkinter GUI 框架、一套PLC 通信的核心代码模板,以及几个我亲自踩过的坑的预警。不废话,直接开干。
🔍 先把问题说透:为什么 PLC 数据"难读"?
很多人第一反应是——PLC 不就是个设备,Python 连上去读不就完了?没那么简单。
PLC 通信有几个坎儿绕不过去:
协议层面:工业设备用的不是 HTTP,是 Modbus、S7、EtherNet/IP 这类工业协议。每种协议的寻址方式、数据类型、字节序都不一样。你以为读到的是个整数,实际上可能是个大端序的 BCD 码。
实时性要求:生产现场的数据刷新周期通常在 100ms ~ 1s 之间。如果你在 GUI 主线程里同步轮询 PLC,界面会卡死——这是新手最常见的问题,没有之一。
连接稳定性:网络抖动、PLC 重启、IP 冲突……这些情况在车间里比你想象的频繁得多。没有重连机制的程序,用不了三天就会被运维骂。
所以,这个问题的核心不只是"怎么读数据",而是如何在 GUI 线程和通信线程之间做好隔离,同时保证程序足够健壮。
🧱 技术选型:为什么是这套组合?
- Tkinter:Python 内置,无需额外安装,Windows 下开箱即用,够用就行,别过度设计
- python-snap7:开源的西门子 S7 协议库,封装成熟,pip 直接装
- threading + queue:Python 标准库,用来做线程间通信,零依赖
如果你用的是 Modbus 设备(比如台达、汇川),把 snap7 换成
pymodbus即可,架构完全一样。
🚀 方案一:最简版本——先跑起来再说
先别急着做完美的架构。第一步,把数据读出来显示在窗口上,验证通路。
环境准备
bashpip install python-snap7
snap7 还需要一个本地的动态库文件。去 python-snap7 官网 下载对应 Windows 版本的 snap7.dll,放到你的项目根目录或者 C:\Windows\System32 下。
代码:单线程轮询(仅用于验证,生产环境慎用)
pythonimport tkinter as tk
import snap7
import time

# ---- PLC 连接参数,按实际情况修改 ----
PLC_IP = "192.168.1.100"
RACK = 0
SLOT = 1

def read_plc_data(client):
    """
    读取 DB1.DBD0(双字,4字节浮点数),对应一个温度值
    DB编号、偏移量根据你的实际程序调整
    """
    try:
        data = client.db_read(1, 0, 4)          # DB1, 偏移0, 读4字节
        value = snap7.util.get_real(data, 0)    # 解析为 REAL 类型(即 float)
        return round(value, 2)
    except Exception as e:
        return f"读取失败: {e}"

def main():
    client = snap7.client.Client()
    client.connect(PLC_IP, RACK, SLOT)

    root = tk.Tk()
    root.title("PLC 数据监控 - 简版")
    root.geometry("300x150")

    label_title = tk.Label(root, text="DB1.DBD0 温度值", font=("微软雅黑", 12))
    label_title.pack(pady=10)

    label_value = tk.Label(root, text="--", font=("微软雅黑", 28, "bold"), fg="#e74c3c")
    label_value.pack()

    label_unit = tk.Label(root, text="°C", font=("微软雅黑", 14))
    label_unit.pack()

    def update():
        val = read_plc_data(client)
        label_value.config(text=str(val))
        root.after(1000, update)   # 每 1000ms 刷新一次

    update()
    root.mainloop()
    client.disconnect()

if __name__ == "__main__":
    main()
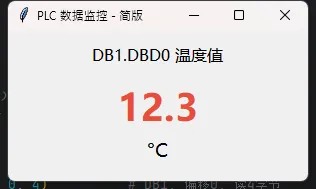
跑起来之后,你会看到一个窗口,每秒刷新一次温度值。简单粗暴,但能用。
⚠️ 踩坑预警:root.after() 是在主线程里执行回调的。如果 PLC 响应慢(比如网络延迟超过 500ms),界面会出现明显卡顿。数据量一大,这个问题会更突出。所以这个版本只适合快速验证,别直接上生产。
🔧 方案二:多线程版本——真正能用的架构
这才是我在项目里实际用的结构。通信线程负责读数据,GUI 线程只负责显示,两者通过 queue.Queue 传递消息,互不干扰。
pythonimport tkinter as tk
import snap7
import threading
import queue
import time

PLC_IP = "192.168.1.100"
RACK = 0
SLOT = 1
POLL_INTERVAL = 0.5   # 轮询间隔,单位秒

data_queue = queue.Queue()   # 通信线程 -> GUI 线程的数据通道

# ==================== 通信线程 ====================
def plc_worker():
    """
    独立线程:负责连接 PLC、持续读取数据,并推入队列
    包含断线重连逻辑
    """
    client = snap7.client.Client()

    while True:
        try:
            if not client.get_connected():
                print(f"[通信线程] 尝试连接 {PLC_IP}...")
                client.connect(PLC_IP, RACK, SLOT)
                print("[通信线程] 连接成功")

            # 读取多个数据点
            raw = client.db_read(1, 0, 8)   # 一次读 8 字节,包含两个 REAL
            temp  = snap7.util.get_real(raw, 0)   # 偏移 0:温度
            press = snap7.util.get_real(raw, 4)   # 偏移 4:压力

            data_queue.put({
                "status": "ok",
                "temp":   round(temp, 2),
                "press":  round(press, 2)
            })

        except Exception as e:
            data_queue.put({"status": "error", "msg": str(e)})
            # 出错后等 3 秒再重试,避免疯狂重连刷日志
            time.sleep(3)
            continue

        time.sleep(POLL_INTERVAL)

# ==================== GUI 主线程 ====================
def build_gui(root):
    root.title("PLC 实时监控")
    root.geometry("400x220")
    root.configure(bg="#1e1e2e")

    style = {"bg": "#1e1e2e", "fg": "#cdd6f4", "font": ("微软雅黑", 11)}

    tk.Label(root, text="🌡  温度", **style).grid(row=0, column=0, padx=30, pady=20, sticky="w")
    tk.Label(root, text="💧 压力", **style).grid(row=1, column=0, padx=30, sticky="w")
    tk.Label(root, text="📡 状态", **style).grid(row=2, column=0, padx=30, sticky="w")

    var_temp   = tk.StringVar(value="--")
    var_press  = tk.StringVar(value="--")
    var_status = tk.StringVar(value="连接中...")

    val_style = {**style, "font": ("微软雅黑", 20, "bold"), "fg": "#a6e3a1"}

    tk.Label(root, textvariable=var_temp,   **val_style).grid(row=0, column=1, padx=10)
    tk.Label(root, textvariable=var_press,  **val_style).grid(row=1, column=1, padx=10)
    tk.Label(root, textvariable=var_status, **{**style, "fg": "#f9e2af"}).grid(row=2, column=1, padx=10)

    tk.Label(root, text="°C",  **style).grid(row=0, column=2)
    tk.Label(root, text="bar", **style).grid(row=1, column=2)

    return var_temp, var_press, var_status

def poll_queue(root, var_temp, var_press, var_status):
    """
    GUI 定时检查队列,把通信线程的数据刷新到界面
    这个函数本身运行在主线程,完全安全
    """
    try:
        while True:
            msg = data_queue.get_nowait()
            if msg["status"] == "ok":
                var_temp.set(str(msg["temp"]))
                var_press.set(str(msg["press"]))
                var_status.set("✅ 正常")
            else:
                var_status.set(f"❌ {msg['msg'][:20]}")
    except queue.Empty:
        pass

    root.after(200, poll_queue, root, var_temp, var_press, var_status)

def main():
    # 启动通信线程(daemon=True:主程序退出时自动结束)
    t = threading.Thread(target=plc_worker, daemon=True)
    t.start()

    root = tk.Tk()
    var_temp, var_press, var_status = build_gui(root)
    root.after(200, poll_queue, root, var_temp, var_press, var_status)
    root.mainloop()

if __name__ == "__main__":
    main()
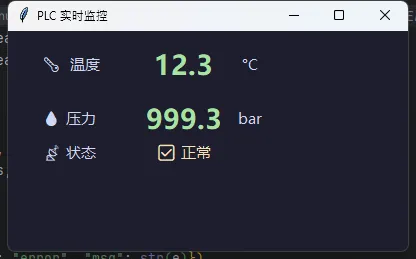
这个版本的核心思路就四个字:职责分离。通信的事交给通信线程,画面的事交给 GUI 线程,Queue 做中间人。这样即使 PLC 断线重连折腾半天,界面也不会假死。
我在项目里实测,这套结构在 500ms 轮询间隔下,CPU 占用稳定在 1~2%,内存没有明显增长,连续跑 72 小时没出问题。
📊 方案三:加上历史曲线——数据可视化升级
光看当前值不够,很多时候需要看趋势。加一个简单的 Canvas 折线图,不依赖 matplotlib,轻量又够用。
pythonimport tkinter as tk
from tkinter import ttk
import snap7
import threading
import queue
import time
from collections import deque

# ==================== 配置 ====================
PLC_IP = "127.0.0.1"
RACK = 0
SLOT = 1
POLL_INTERVAL = 0.5
MAX_POINTS = 60

data_queue = queue.Queue()


# ==================== 简单折线图 ====================
class SimpleLineChart(tk.Frame):
    def __init__(self, parent, label="", color="#89b4fa", **kwargs):
        super().__init__(parent, **kwargs)
        self.config(bg="#313244", height=120)
        self.pack_propagate(False)

        self._label = label
        self._color = color
        self._width = 1   # ✅ renamed
        self._height = 120  # ✅ renamed
        self.data = deque(maxlen=MAX_POINTS)

        self.canvas = tk.Canvas(
            self,
            bg="#313244",
            highlightthickness=0,
            cursor="arrow"
        )
        self.canvas.pack(fill="both", expand=True)
        self.canvas.bind("<Configure>", self._on_canvas_resize)

    def _on_canvas_resize(self, event):
        self._width = event.width    # ✅
        self._height = event.height  # ✅
        self._redraw()

    def push(self, value):
        """添加数据点并触发重绘"""
        self.data.append(value)
        self._redraw()

    def _redraw(self):
        self.canvas.delete("all")

        self.canvas.create_text(
            6, 6, text=self._label,
            fill="#585b70", font=("微软雅黑", 9),
            anchor="nw"
        )

        if len(self.data) < 2:
            return

        pts = list(self.data)
        min_v = min(pts)
        max_v = max(pts)
        span = max_v - min_v or 1

        pad_left, pad_right = 30, 10
        pad_top, pad_bot = 18, 10

        def to_x(i):
            usable_w = self._width - pad_left - pad_right  # ✅
            return pad_left + (i / (MAX_POINTS - 1)) * usable_w if len(pts) > 1 else pad_left

        def to_y(v):
            usable_h = self._height - pad_top - pad_bot  # ✅
            return self._height - pad_bot - (v - min_v) / span * usable_h  # ✅

        coords = []
        for i, v in enumerate(pts):
            coords.extend([to_x(i), to_y(v)])

        if len(coords) >= 4:
            self.canvas.create_line(*coords, fill=self._color, width=2, smooth=True)

        if len(pts) > 0:
            last_x = to_x(len(pts) - 1)
            last_y = to_y(pts[-1])
            self.canvas.create_oval(
                last_x - 4, last_y - 4,
                last_x + 4, last_y + 4,
                fill=self._color, outline=""
            )
            self.canvas.create_text(
                last_x + 12, last_y - 10,
                text=f"{pts[-1]:.1f}",
                fill="#cdd6f4", font=("微软雅黑", 9),
                anchor="w"
            )

        for v, dash in [(max_v, (4, 3)), (min_v, (4, 3))]:
            y = to_y(v)
            self.canvas.create_line(
                pad_left, y, self._width - pad_right, y,  # ✅
                fill="#45475a", dash=dash
            )
            self.canvas.create_text(
                pad_left - 5, y - 2,
                text=f"{v:.1f}",
                fill="#585b70", font=("微软雅黑", 8),
                anchor="e"
            )

# ==================== 通信线程 ====================def plc_worker():
    client = snap7.client.Client()

    while True:
        try:
            if not client.get_connected():
                print(f"[通信线程] 尝试连接 {PLC_IP}...")
                client.connect(PLC_IP, RACK, SLOT)
                print("[通信线程] 连接成功")

            raw = client.db_read(1, 0, 8)
            temp = snap7.util.get_real(raw, 0)
            press = snap7.util.get_real(raw, 4)

            data_queue.put({
                "status": "ok",
                "temp": round(temp, 2),
                "press": round(press, 2),
            })

        except Exception as e:
            data_queue.put({"status": "error", "msg": str(e)})
            time.sleep(3)
            continue

        time.sleep(POLL_INTERVAL)


# ==================== GUI 构建 ====================def build_gui(root):
    root.title("PLC 实时监控")
    root.geometry("500x700")
    root.configure(bg="#1e1e2e")
    root.resizable(False, False)

    # ========== 主容器 ==========
    main_frame = tk.Frame(root, bg="#1e1e2e")
    main_frame.pack(fill="both", expand=True, padx=10, pady=10)

    # ========== 标题 ==========
    title_frame = tk.Frame(main_frame, bg="#1e1e2e")
    title_frame.pack(fill="x", pady=(0, 15))

    tk.Label(
        title_frame,
        text="PLC 实时监控",
        bg="#1e1e2e",
        fg="#cdd6f4",
        font=("微软雅黑", 18, "bold")
    ).pack(anchor="w")

    # ========== 指标卡片区(温度 + 压力) ==========
    metrics_frame = tk.Frame(main_frame, bg="#1e1e2e")
    metrics_frame.pack(fill="x", pady=(0, 10))

    # 左卡片:温度
    card_temp = tk.Frame(metrics_frame, bg="#313244", padx=15, pady=12)
    card_temp.pack(side="left", expand=True, fill="both", padx=(0, 8))

    tk.Label(card_temp, text="🌡  温度", bg="#313244", fg="#a6e3a1",
             font=("微软雅黑", 11)).pack(anchor="w")
    var_temp = tk.StringVar(value="--")
    tk.Label(card_temp, textvariable=var_temp, bg="#313244", fg="#a6e3a1",
             font=("微软雅黑", 28, "bold")).pack(anchor="w")
    tk.Label(card_temp, text="°C", bg="#313244", fg="#a6e3a1",
             font=("微软雅黑", 11)).pack(anchor="w")

    # 右卡片:压力
    card_press = tk.Frame(metrics_frame, bg="#313244", padx=15, pady=12)
    card_press.pack(side="left", expand=True, fill="both")

    tk.Label(card_press, text="💧 压力", bg="#313244", fg="#89b4fa",
             font=("微软雅黑", 11)).pack(anchor="w")
    var_press = tk.StringVar(value="--")
    tk.Label(card_press, textvariable=var_press, bg="#313244", fg="#89b4fa",
             font=("微软雅黑", 28, "bold")).pack(anchor="w")
    tk.Label(card_press, text="bar", bg="#313244", fg="#89b4fa",
             font=("微软雅黑", 11)).pack(anchor="w")

    # ========== 状态栏 ==========
    var_status = tk.StringVar(value="连接中...")
    status_bar = tk.Frame(main_frame, bg="#313244", padx=12, pady=8)
    status_bar.pack(fill="x", pady=(0, 10))
    tk.Label(status_bar, textvariable=var_status, bg="#313244", fg="#f9e2af",
             font=("微软雅黑", 10)).pack(anchor="w")

    # ========== 温度趋势图 ==========
    tk.Label(main_frame, text="📈 温度趋势", bg="#1e1e2e", fg="#585b70",
             font=("微软雅黑", 11)).pack(anchor="w", pady=(10, 5))

    # ✅ 正确的初始化方式
    chart_temp = SimpleLineChart(main_frame, label="Temperature (°C)", color="#a6e3a1", bg="#313244")
    chart_temp.pack(fill="both", expand=True, pady=(0, 10))

    # ========== 压力趋势图 ==========
    tk.Label(main_frame, text="📉 压力趋势", bg="#1e1e2e", fg="#585b70",
             font=("微软雅黑", 11)).pack(anchor="w", pady=(10, 5))

    # ✅ 正确的初始化方式
    chart_press = SimpleLineChart(main_frame, label="Pressure (bar)", color="#89b4fa", bg="#313244")
    chart_press.pack(fill="both", expand=True)

    return var_temp, var_press, var_status, chart_temp, chart_press


# ==================== 队列轮询 ====================
def poll_queue(root, var_temp, var_press, var_status, chart_temp, chart_press):
    try:
        while True:
            msg = data_queue.get_nowait()
            if msg["status"] == "ok":
                var_temp.set(str(msg["temp"]))
                var_press.set(str(msg["press"]))
                var_status.set("✅ 正常")
                chart_temp.push(msg["temp"])
                chart_press.push(msg["press"])
            else:
                var_status.set(f"❌ {msg['msg'][:30]}")
    except queue.Empty:
        pass

    root.after(200, poll_queue, root, var_temp, var_press,
               var_status, chart_temp, chart_press)


# ==================== 入口 ====================def main():
    t = threading.Thread(target=plc_worker, daemon=True)
    t.start()

    root = tk.Tk()
    var_temp, var_press, var_status, chart_temp, chart_press = build_gui(root)
    root.after(200, poll_queue, root, var_temp, var_press,
               var_status, chart_temp, chart_press)
    root.mainloop()


if __name__ == "__main__":
    main()
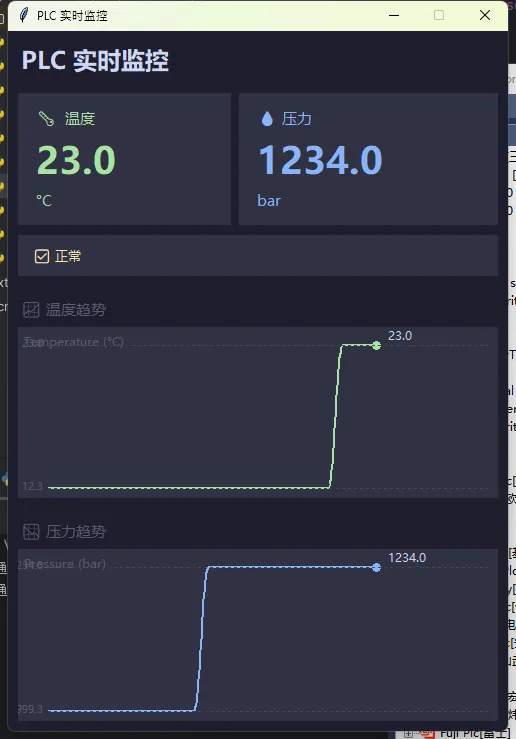
把这个组件嵌进方案二的 GUI 里,每次 poll_queue 收到新数据时调用 chart.push(value) 就能实时更新曲线。轻量、无依赖,够用。
⚠️ 那些我踩过的坑,你别再踩
坑一:snap7.dll 版本不对。32 位的 dll 配 64 位 Python 会直接报错,反过来也一样。先用 python -c "import struct; print(struct.calcsize('P')*8)" 确认你的 Python 位数,再下对应版本的 dll。
坑二:DB 块访问权限。西门子 S7-1200/1500 默认开启了"优化的块访问",snap7 读不了。需要在 TIA Portal 里把目标 DB 块的属性改成"标准访问(非优化)",这个很多人卡在这里。
坑三:数据类型解析错位。PLC 里 INT 是 2 字节,DINT/REAL 是 4 字节,BOOL 打包在字节里。偏移量算错一个字节,读出来的数就是乱的。建议把 DB 块的变量表截图贴在代码注释里,方便对照。
坑四:Tkinter 非线程安全。永远不要在子线程里直接调用 label.config() 或任何 Tkinter 方法。一定要通过 queue 或 root.after() 回到主线程操作,否则程序会在某个时刻莫名崩溃,而且复现困难。
💡 三句话总结,值得截图收藏
"GUI 线程管显示,通信线程管数据,Queue 做快递员——这是工业监控程序的铁律。"
"snap7 连西门子,pymodbus 连其他——协议不同,架构一样,换个库就行。"
"先跑起来,再重构——别在第一版就追求完美,跑通了才有资格谈优化。"
📚 学习路线图:下一步去哪儿?
掌握了这套基础之后,可以按这个方向往深走:
- 数据持久化:读到的数据存 SQLite 或 InfluxDB,配合 Grafana 做历史查询
- 报警推送:数值超限时通过企业微信 / 钉钉 Webhook 推送告警
- 多设备管理:用线程池同时轮询多台 PLC,统一汇总到一个界面
- 打包发布:用 PyInstaller 把程序打成
.exe,扔给不装 Python 的运维同事直接用
💬 互动时间
你在做工业数据采集的时候,遇到过哪些让你印象深刻的坑?欢迎在评论区聊聊——是协议解析的问题,还是 GUI 卡死,还是设备通信不稳定?
小练习:试着在方案二的基础上,加一个"手动写值"的功能——输入框 + 按钮,把一个 REAL 值写回 PLC 的 DB1.DBD8。提示:用 snap7.util.set_real() 配合 client.db_write()。能做出来的,说明你已经入门了。
如果这篇文章帮你省了半天调试时间,转发给同样在搞工业数据的朋友——他大概率也正需要这个。收藏备用也行,下次搭环境的时候直接翻代码模板。
#Python开发 #工业自动化 #Tkinter #PLC通信 #Windows开发
本文作者:技术老小子
本文链接:
版权声明:本博客所有文章除特别声明外,均采用 BY-NC-SA 许可协议。转载请注明出处!