
目录
你是否在项目中遇到过这样的需求:老板要求做一个数据报表,表头需要分组显示,比如"个人信息"下包含"姓名"和"性别","成绩统计"下包含各科成绩?传统的DataGridView根本无法满足这种复杂表头需求,网上找的第三方控件要么收费昂贵,要么功能受限。
今天写一个简单例子分享给大家,100%纯原生C#代码,零第三方依赖,完美解决复杂表头难题,不过样式就不太好看了。
💡 问题深度分析
🔍 为什么原生DataGridView无法满足需求?
标准的DataGridView设计理念是"一列一表头",这种简单粗暴的设计在处理复杂业务场景时就显得力不从心了:
- 表头分组需求:财务报表、学生成绩单、生产数据统计等都需要分组显示
- 视觉层次感:扁平化的表头无法突出数据的逻辑关系
- 用户体验差:信息密度高的表格缺乏清晰的视觉引导
🎯 核心解决思路
既然原生控件不支持,我们就通过自定义绘制来实现:
- 继承DataGridView,重写绘制事件
- 将表头高度扩展为双倍,分为上下两层
- 上层绘制分组信息,下层绘制具体列名
- 通过精确的坐标计算实现完美对齐
🚀 代码实战:从零开始构建多级表头
📋 核心类设计
首先,我们需要定义一个数据结构来描述表头分组:
C#// 列头分组信息类
public class ColumnHeaderGroup
{
    public string HeaderText { get; set; }           // 分组名称
    public List<int> ColumnIndices { get; set; } = new List<int>(); // 包含的列索引
}
🎨 自定义DataGridView核心实现
C#public class MultiLevelHeaderDataGridView : DataGridView
{
    // 存储所有的表头分组
    public List<ColumnHeaderGroup> HeaderGroups = new List<ColumnHeaderGroup>();

    public MultiLevelHeaderDataGridView()
    {
        // 关键:将表头高度扩展为双倍,为分组预留空间
        this.ColumnHeadersHeight = this.ColumnHeadersHeight * 2;
    }

    protected override void OnCellPainting(DataGridViewCellPaintingEventArgs e)
    {
        base.OnCellPainting(e);

        // 只处理表头行的绘制(RowIndex == -1 表示表头)
        if (e.RowIndex == -1 && e.ColumnIndex >= 0)
        {
            e.Handled = true; // 接管绘制过程
            Graphics g = e.Graphics;
            Rectangle cellBounds = e.CellBounds;

            // 计算上下两层的高度分配
            int totalHeaderHeight = this.ColumnHeadersHeight;
            int firstLevelHeight = totalHeaderHeight / 2;  // 上层:分组
            int secondLevelHeight = totalHeaderHeight - firstLevelHeight; // 下层:列名

            // 🎨 绘制单元格背景(渐变效果提升视觉体验)
            using (LinearGradientBrush backBrush = new LinearGradientBrush(cellBounds,
                   Color.LightSteelBlue, Color.White, 90f))
            {
                g.FillRectangle(backBrush, cellBounds);
            }

            // 🔤 绘制具体列名(下半部分)
            Rectangle columnNameRect = new Rectangle(
                cellBounds.Left + 1,
                cellBounds.Top + firstLevelHeight,
                cellBounds.Width - 2,
                secondLevelHeight
            );

            TextRenderer.DrawText(g, this.Columns[e.ColumnIndex].HeaderText,
                new Font(this.ColumnHeadersDefaultCellStyle.Font, FontStyle.Bold),
                columnNameRect, Color.Navy,
                TextFormatFlags.HorizontalCenter | TextFormatFlags.VerticalCenter);

            // 🖼️ 绘制边框线
            using (Pen gridPen = new Pen(Color.SteelBlue, 1))
            {
                g.DrawLine(gridPen, cellBounds.Left, cellBounds.Bottom - 1,
                          cellBounds.Right, cellBounds.Bottom - 1);
                g.DrawLine(gridPen, cellBounds.Right - 1, cellBounds.Top,
                          cellBounds.Right - 1, cellBounds.Bottom);
            }

            // 🏷️ 绘制分组表头(上半部分)
            DrawGroupHeader(g, e, firstLevelHeight, cellBounds);
        }

        // 处理左上角空白区域
        if (e.RowIndex == -1 && e.ColumnIndex == -1)
        {
            e.Handled = true;
            using (SolidBrush backBrush = new SolidBrush(Color.LightSteelBlue))
            {
                e.Graphics.FillRectangle(backBrush, e.CellBounds);
            }
        }
    }

    // 分组表头绘制逻辑
    private void DrawGroupHeader(Graphics g, DataGridViewCellPaintingEventArgs e,
                                int firstLevelHeight, Rectangle cellBounds)
    {
        foreach (var group in HeaderGroups)
        {
            if (group.ColumnIndices.Contains(e.ColumnIndex))
            {
                // 计算分组跨越的总宽度
                int firstColIndex = group.ColumnIndices[0];
                int lastColIndex = group.ColumnIndices[group.ColumnIndices.Count - 1];

                Rectangle leftCell = this.GetCellDisplayRectangle(firstColIndex, -1, true);
                Rectangle rightCell = this.GetCellDisplayRectangle(lastColIndex, -1, true);

                Rectangle groupRect = new Rectangle(
                    leftCell.Left + 1,
                    cellBounds.Top + 1,
                    rightCell.Right - leftCell.Left - 2,
                    firstLevelHeight - 2
                );

                // 绘制分组背景
                using (LinearGradientBrush groupBrush = new LinearGradientBrush(groupRect,
                    Color.SteelBlue, Color.LightSkyBlue, 90f))
                {
                    g.FillRectangle(groupBrush, groupRect);
                }

                // 绘制分组边框
                using (Pen borderPen = new Pen(Color.DodgerBlue, 1))
                {
                    g.DrawRectangle(borderPen, groupRect);
                }

                // 绘制分组文字
                TextRenderer.DrawText(g, group.HeaderText,
                    new Font(this.ColumnHeadersDefaultCellStyle.Font, FontStyle.Bold),
                    groupRect, Color.White,
                    TextFormatFlags.HorizontalCenter | TextFormatFlags.VerticalCenter);

                break; // 找到对应分组后退出循环
            }
        }
    }

    // 🔄 重要:响应各种界面变化事件,确保表头正确刷新
    protected override void OnColumnWidthChanged(DataGridViewColumnEventArgs e)
    {
        base.OnColumnWidthChanged(e);
        this.Invalidate(); // 列宽改变时重绘
    }

    protected override void OnScroll(ScrollEventArgs e)
    {
        base.OnScroll(e);
        this.Invalidate(); // 滚动时重绘
    }

    protected override void OnSizeChanged(EventArgs e)
    {
        base.OnSizeChanged(e);
        this.Invalidate(); // 窗口大小改变时重绘
    }
}
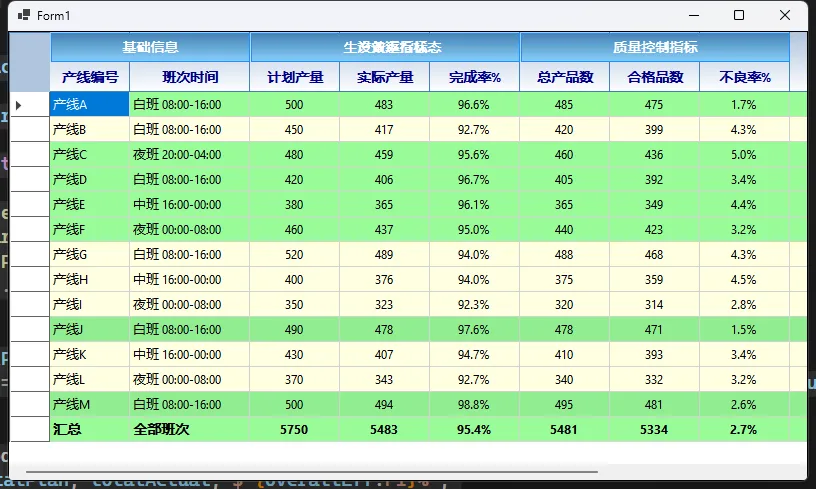
🏭 工业应用场景:生产数据监控大屏
让我们将上面的学生成绩示例改写为更贴近实际工业应用的生产线数据监控:
C#using static AppDataGridMHeader.MergeHeaderDataGridView;

namespace AppDataGridMHeader
{
    public partial class Form1 : Form
    {
        private MultiLevelHeaderDataGridView dgvProduction;
        private System.Windows.Forms.Timer updateTimer;
        private Random random = new Random();
        public Form1()
        {
            InitializeComponent();
            InitializeProductionDataGridView();
            LoadProductionData();
            AddSummaryRow();
            InitializeTimer();
        }
        private void InitializeProductionDataGridView()
        {
            dgvProduction = new MultiLevelHeaderDataGridView
            {
                Dock = DockStyle.Fill,
                AllowUserToAddRows = false,
                AllowUserToDeleteRows = false,
                ReadOnly = true, // 生产数据只读
                ColumnHeadersHeightSizeMode = DataGridViewColumnHeadersHeightSizeMode.DisableResizing,
                ColumnHeadersHeight = 60,
                BackgroundColor = Color.White,
                GridColor = Color.LightGray
            };

            // 🏭 添加生产线相关列
            dgvProduction.Columns.Add("lineCode", "产线编号");
            dgvProduction.Columns.Add("shiftTime", "班次时间");

            // 生产效率指标组
            dgvProduction.Columns.Add("planOutput", "计划产量");
            dgvProduction.Columns.Add("actualOutput", "实际产量");
            dgvProduction.Columns.Add("efficiency", "完成率%");

            // 质量指标组
            dgvProduction.Columns.Add("totalProducts", "总产品数");
            dgvProduction.Columns.Add("qualifiedProducts", "合格品数");
            dgvProduction.Columns.Add("defectRate", "不良率%");

            // 设备状态组
            dgvProduction.Columns.Add("machineStatus", "设备状态");
            dgvProduction.Columns.Add("runningTime", "运行时长");
            dgvProduction.Columns.Add("downTime", "停机时长");

            // 🎨 设置列宽和样式
            dgvProduction.Columns[0].Width = 80;  // 产线编号
            dgvProduction.Columns[1].Width = 120; // 班次时间

            for (int i = 2; i < dgvProduction.Columns.Count; i++)
            {
                dgvProduction.Columns[i].Width = 90;
                dgvProduction.Columns[i].DefaultCellStyle.Alignment = DataGridViewContentAlignment.MiddleCenter;
            }

            // 📊 定义分组表头
            dgvProduction.HeaderGroups.Add(new MultiLevelHeaderDataGridView.ColumnHeaderGroup
            {
                HeaderText = "基础信息",
                ColumnIndices = new List<int> { 0, 1 }
            });

            dgvProduction.HeaderGroups.Add(new MultiLevelHeaderDataGridView.ColumnHeaderGroup
            {
                HeaderText = "生产效率指标",
                ColumnIndices = new List<int> { 2, 3, 4 }
            });

            dgvProduction.HeaderGroups.Add(new MultiLevelHeaderDataGridView.ColumnHeaderGroup
            {
                HeaderText = "质量控制指标",
                ColumnIndices = new List<int> { 5, 6, 7 }
            });

            dgvProduction.HeaderGroups.Add(new MultiLevelHeaderDataGridView.ColumnHeaderGroup
            {
                HeaderText = "设备运行状态",
                ColumnIndices = new List<int> { 8, 9, 10 }
            });

            this.Controls.Add(dgvProduction);
        }

        private void LoadProductionData()
        {
            var productionData = new[]
            {
        new { Line = "产线A", Shift = "白班 08:00-16:00", Plan = 500, Actual = 485, Eff = 97.0,
              Total = 485, Qualified = 470, DefectRate = 3.1, Status = "运行中",
              RunTime = "7.2h", DownTime = "0.8h" },
        new { Line = "产线B", Shift = "白班 08:00-16:00", Plan = 450, Actual = 420, Eff = 93.3,
              Total = 420, Qualified = 408, DefectRate = 2.9, Status = "运行中",
              RunTime = "7.5h", DownTime = "0.5h" },
        new { Line = "产线C", Shift = "夜班 20:00-04:00", Plan = 480, Actual = 460, Eff = 95.8,
              Total = 460, Qualified = 445, DefectRate = 3.3, Status = "维护中",
              RunTime = "6.8h", DownTime = "1.2h" },
        new { Line = "产线D", Shift = "白班 08:00-16:00", Plan = 420, Actual = 405, Eff = 96.4,
              Total = 405, Qualified = 392, DefectRate = 3.2, Status = "运行中",
              RunTime = "7.8h", DownTime = "0.2h" },
        new { Line = "产线E", Shift = "中班 16:00-00:00", Plan = 380, Actual = 365, Eff = 96.1,
              Total = 365, Qualified = 354, DefectRate = 3.0, Status = "运行中",
              RunTime = "7.6h", DownTime = "0.4h" },
        new { Line = "产线F", Shift = "夜班 00:00-08:00", Plan = 460, Actual = 440, Eff = 95.7,
              Total = 440, Qualified = 425, DefectRate = 3.4, Status = "故障中",
              RunTime = "6.5h", DownTime = "1.5h" },
        new { Line = "产线G", Shift = "白班 08:00-16:00", Plan = 520, Actual = 488, Eff = 93.8,
              Total = 488, Qualified = 468, DefectRate = 4.1, Status = "运行中",
              RunTime = "7.4h", DownTime = "0.6h" },
        new { Line = "产线H", Shift = "中班 16:00-00:00", Plan = 400, Actual = 375, Eff = 93.8,
              Total = 375, Qualified = 361, DefectRate = 3.7, Status = "运行中",
              RunTime = "7.3h", DownTime = "0.7h" },
        new { Line = "产线I", Shift = "夜班 00:00-08:00", Plan = 350, Actual = 320, Eff = 91.4,
              Total = 320, Qualified = 305, DefectRate = 4.7, Status = "调试中",
              RunTime = "6.8h", DownTime = "1.2h" },
        new { Line = "产线J", Shift = "白班 08:00-16:00", Plan = 490, Actual = 478, Eff = 97.6,
              Total = 478, Qualified = 465, DefectRate = 2.7, Status = "运行中",
              RunTime = "7.9h", DownTime = "0.1h" },
        new { Line = "产线K", Shift = "中班 16:00-00:00", Plan = 430, Actual = 410, Eff = 95.3,
              Total = 410, Qualified = 395, DefectRate = 3.7, Status = "运行中",
              RunTime = "7.1h", DownTime = "0.9h" },
        new { Line = "产线L", Shift = "夜班 00:00-08:00", Plan = 370, Actual = 340, Eff = 91.9,
              Total = 340, Qualified = 324, DefectRate = 4.7, Status = "待料中",
              RunTime = "5.8h", DownTime = "2.2h" },
        new { Line = "产线M", Shift = "白班 08:00-16:00", Plan = 500, Actual = 495, Eff = 99.0,
              Total = 495, Qualified = 485, DefectRate = 2.0, Status = "运行中",
              RunTime = "7.8h", DownTime = "0.2h" }
    };

            // 清空现有数据
            dgvProduction.Rows.Clear();

            foreach (var data in productionData)
            {
                int rowIndex = dgvProduction.Rows.Add(
                    data.Line, data.Shift, data.Plan, data.Actual, $"{data.Eff:F1}%",
                    data.Total, data.Qualified, $"{data.DefectRate:F1}%",
                    data.Status, data.RunTime, data.DownTime
                );

                // 🎨 根据效率设置行颜色
                var row = dgvProduction.Rows[rowIndex];
                if (data.Eff >= 97)
                    row.DefaultCellStyle.BackColor = Color.LightGreen;      // 优秀
                else if (data.Eff >= 95)
                    row.DefaultCellStyle.BackColor = Color.PaleGreen;       // 良好
                else if (data.Eff >= 92)
                    row.DefaultCellStyle.BackColor = Color.LightYellow;     // 一般
                else
                    row.DefaultCellStyle.BackColor = Color.LightPink;       // 需改进

                // 🚦 设置设备状态列颜色
                switch (data.Status)
                {
                    case "运行中":
                        row.Cells[8].Style.ForeColor = Color.Green;
                        row.Cells[8].Style.Font = new Font(dgvProduction.Font, FontStyle.Bold);
                        break;
                    case "维护中":
                        row.Cells[8].Style.ForeColor = Color.Orange;
                        row.Cells[8].Style.Font = new Font(dgvProduction.Font, FontStyle.Bold);
                        break;
                    case "故障中":
                    case "待料中":
                        row.Cells[8].Style.ForeColor = Color.Red;
                        row.Cells[8].Style.Font = new Font(dgvProduction.Font, FontStyle.Bold);
                        break;
                    case "调试中":
                        row.Cells[8].Style.ForeColor = Color.Blue;
                        row.Cells[8].Style.Font = new Font(dgvProduction.Font, FontStyle.Bold);
                        break;
                }
            }
        }

        private void InitializeTimer()
        {
            updateTimer = new System.Windows.Forms.Timer();
            updateTimer.Interval = 1000; // 每5秒更新一次
            updateTimer.Tick += UpdateTimer_Tick;
            updateTimer.Start();
        }

        private void UpdateTimer_Tick(object sender, EventArgs e)
        {
            // 🔄 动态更新生产数据
            UpdateProductionDataDynamically();
        }

        private void UpdateProductionDataDynamically()
        {
            foreach (DataGridViewRow row in dgvProduction.Rows)
            {
                if (row.IsNewRow) continue;

                // 🎲 随机变化实际产量(±5以内)
                if (int.TryParse(row.Cells[3].Value?.ToString(), out int currentActual))
                {
                    int planOutput = int.Parse(row.Cells[2].Value.ToString());
                    int variation = random.Next(-3, 4); // -3到3的随机变化
                    int newActual = Math.Max(0, Math.Min(planOutput + 20, currentActual + variation));

                    row.Cells[3].Value = newActual;

                    // 重新计算效率
                    double newEff = (double)newActual / planOutput * 100;
                    row.Cells[4].Value = $"{newEff:F1}%";

                    // 更新质量数据
                    int newQualified = (int)(newActual * (0.95 + random.NextDouble() * 0.04)); // 95%-99%合格率
                    row.Cells[6].Value = newQualified;

                    double newDefectRate = (double)(newActual - newQualified) / newActual * 100;
                    row.Cells[7].Value = $"{newDefectRate:F1}%";

                    // 🎨 动态更新行颜色
                    if (newEff >= 97)
                        row.DefaultCellStyle.BackColor = Color.LightGreen;
                    else if (newEff >= 95)
                        row.DefaultCellStyle.BackColor = Color.PaleGreen;
                    else if (newEff >= 92)
                        row.DefaultCellStyle.BackColor = Color.LightYellow;
                    else
                        row.DefaultCellStyle.BackColor = Color.LightPink;
                }

                // 🚦 随机更新设备状态(小概率)
                if (random.Next(100) < 5) // 5%概率状态变化
                {
                    string[] statuses = { "运行中", "运行中", "运行中", "维护中", "故障中" }; // 运行中概率更高
                    string newStatus = statuses[random.Next(statuses.Length)];
                    row.Cells[8].Value = newStatus;

                    // 更新状态颜色
                    switch (newStatus)
                    {
                        case "运行中":
                            row.Cells[8].Style.ForeColor = Color.Green;
                            break;
                        case "维护中":
                            row.Cells[8].Style.ForeColor = Color.Orange;
                            break;
                        case "故障中":
                            row.Cells[8].Style.ForeColor = Color.Red;
                            break;
                    }
                }

                // 📊 动态更新运行时长
                if (row.Cells[9].Value?.ToString().Contains("h") == true)
                {
                    string runTimeStr = row.Cells[9].Value.ToString().Replace("h", "");
                    if (double.TryParse(runTimeStr, out double runTime))
                    {
                        // 运行时长缓慢增加
                        double newRunTime = Math.Min(8.0, runTime + 0.1);
                        row.Cells[9].Value = $"{newRunTime:F1}h";

                        // 相应调整停机时长
                        double downTime = 8.0 - newRunTime;
                        row.Cells[10].Value = $"{downTime:F1}h";
                    }
                }
            }
        }

        // 📊 添加数据统计功能
        private void AddSummaryRow()
        {
            // 计算汇总数据
            int totalPlan = 0, totalActual = 0, totalProducts = 0, totalQualified = 0;

            foreach (DataGridViewRow row in dgvProduction.Rows)
            {
                if (row.IsNewRow) continue;

                totalPlan += int.Parse(row.Cells[2].Value?.ToString() ?? "0");
                totalActual += int.Parse(row.Cells[3].Value?.ToString() ?? "0");
                totalProducts += int.Parse(row.Cells[5].Value?.ToString() ?? "0");
                totalQualified += int.Parse(row.Cells[6].Value?.ToString() ?? "0");
            }

            double overallEff = totalPlan > 0 ? (double)totalActual / totalPlan * 100 : 0;
            double overallDefectRate = totalProducts > 0 ? (double)(totalProducts - totalQualified) / totalProducts * 100 : 0;

            // 添加汇总行
            int summaryIndex = dgvProduction.Rows.Add(
                "汇总", "全部班次", totalPlan, totalActual, $"{overallEff:F1}%",
                totalProducts, totalQualified, $"{overallDefectRate:F1}%",
                "", "", ""
            );

            // 设置汇总行样式
            var summaryRow = dgvProduction.Rows[summaryIndex];
            summaryRow.DefaultCellStyle.BackColor = Color.LightBlue;
            summaryRow.DefaultCellStyle.Font = new Font(dgvProduction.Font, FontStyle.Bold);
        }
    }
}
⚡ 性能优化与最佳实践
🔧 常见坑点提醒
内存泄漏风险:绘制过程中创建的Brush、Pen等GDI+对象必须及时释放
C#// ❌ 错误做法
Brush brush = new SolidBrush(Color.Red);
// 忘记释放,造成内存泄漏

// ✅ 正确做法
using (Brush brush = new SolidBrush(Color.Red))
{
    // 使用brush
} // 自动释放资源
刷新频率过高:避免在不必要的事件中调用Invalidate()
坐标计算错误:注意滚动条对坐标的影响,使用GetCellDisplayRectangle获取准确位置
🚀 性能优化技巧
C#// 📈 优化技巧1:缓存字体对象
private Font _headerFont;
public MultiLevelHeaderDataGridView()
{
    _headerFont = new Font(this.ColumnHeadersDefaultCellStyle.Font, FontStyle.Bold);
}

// 📈 优化技巧2:减少重绘区域
protected override void OnInvalidated(InvalidateEventArgs e)
{
    // 只重绘表头区域
    Rectangle headerRect = new Rectangle(0, 0, this.Width, this.ColumnHeadersHeight);
    base.OnInvalidated(new InvalidateEventArgs(headerRect));
}
🎯 总结
通过自定义绘制,我们成功实现了功能强大、性能优秀、完全可控的多级表头DataGridView。这个解决方案具有以下核心优势:
- 零依赖:100%原生C#代码,无需第三方控件
- 高度可定制:颜色、字体、布局完全可控
- 性能优异:合理的绘制逻辑,流畅的用户体验
💬 互动时间
你在项目中是如何处理复杂表头需求的?有没有遇到过更具挑战性的表格显示场景?欢迎在评论区分享你的经验和问题!
如果这篇文章帮助到了你,请转发给更多的C#开发同行,让我们一起提升开发效率!
关注我,获取更多C#实战技巧和最佳实践分享!
相关信息
通过网盘分享的文件:AppDataGridMHeader.zip 链接: https://pan.baidu.com/s/1Sr0qaIgjZZjcvOQc0NoumA?pwd=6efs 提取码: 6efs --来自百度网盘超级会员v9的分享
本文作者:技术老小子
本文链接:
版权声明:本博客所有文章除特别声明外,均采用 BY-NC-SA 许可协议。转载请注明出处!