目录
摘要
LiveCharts2 是一款常用的图表库,柱状图是其中最为常见的一种,也是很多应用场景中最为实用的图表类型之一。
在柱状图中,每个柱子表示一个数据项,柱子的高度表示该数据项的大小或重要性。柱状图通常用于比较不同数据项之间的大小关系,可以直观地呈现出数据的分布情况和趋势变化。
在 LiveCharts2 中,使用柱状图的方法比较简单,只需要定义一组柱子的样式和数据,即可生成柱状图。在柱状图的定义中,可以设置柱子的样式,如颜色、大小、宽度等等;还可以设置柱子的位置、间距、动画效果等等。此外,还可以对柱状图进行多种交互操作,如放大缩小、切换数据、滑动数据范围等等。
柱状图的应用非常广泛,比如可以用于展示销售额、市场份额、用户评分等数据;还可以用于比较不同产品或服务的性能指标;还可以用于展示各个国家或地区的GDP、人口、文化等数据等等。
正文
.net 6下需要单独安装
现在最新版本通过Nuget命令安装
https://www.nuget.org/packages/LiveChartsCore.SkiaSharpView.WinForms 下载最新的版本
NuGet\Install-Package LiveChartsCore.SkiaSharpView.WinForms -Version 2.0.0-beta.860
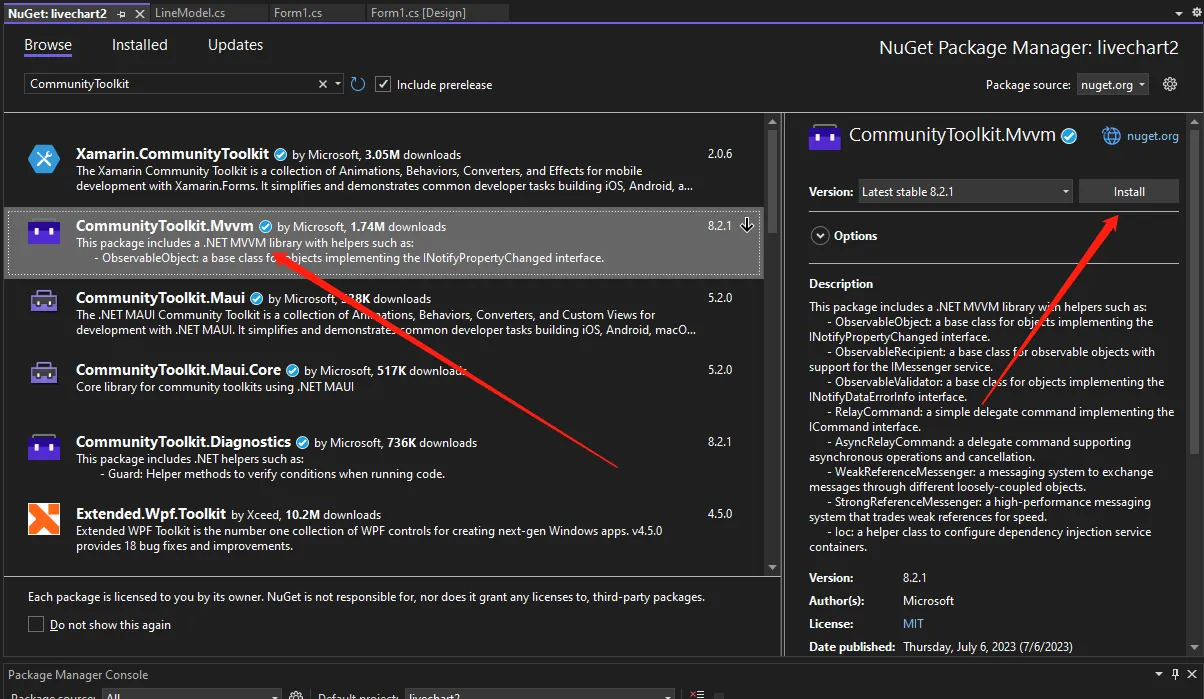
安装CommunityToolkit.Mvvm.ComponentModel
ColumnSeries为柱系列
Stroke:描边
AnimationsSpeed:动画显示
Fill:设置填充属性来创建一个区域系列,默认情况下,该系列有一个基于应用程序主题的填充颜色
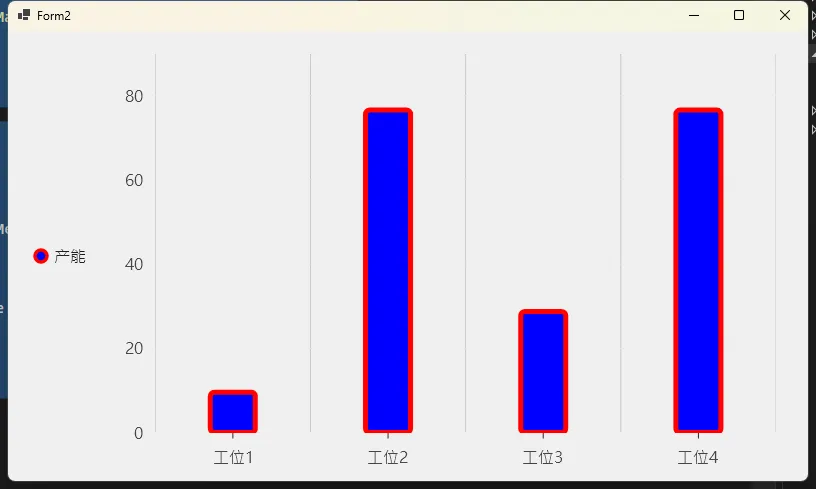
写一个模型
C#public class BarModel : ObservableObject
{
    public ISeries[] Series { get; set; } =
    {
        new ColumnSeries<double>
        {
            Name= "产能",
            Values=new double[] {10,80,30,80}, //这里只指有4个柱子,每个数是一个柱子
            AnimationsSpeed=new TimeSpan(0,0,0,4),//动画时长
            //描边
            Stroke=new SolidColorPaint
            {
                Color = SKColors.Red,
                StrokeThickness = 5
            },
            Fill = new SolidColorPaint(SKColors.Blue),
            IsHoverable = false, //鼠标移上去不显示tips,
        }
    };
    public Axis[] XAxes { get; set; } =
    {
        new Axis
        {
            Labels = new string[] { "工位1","工位2","工位3","工位4"},
            LabelsRotation = 0,//旋转显示
            SeparatorsPaint = new SolidColorPaint(new SKColor(200, 200, 200)),
            SeparatorsAtCenter = false,
            TicksPaint = new SolidColorPaint(new SKColor(35, 35, 35)),
            TicksAtCenter = true
        }
    };
}
C#public partial class Form2 : Form
{
    CartesianChart cartesianChart1 = new CartesianChart();
    public Form2()
    {
        InitializeComponent();
        //配制全局中文显示,不然会乱码
        LiveCharts.Configure(x =>
        {
            x.HasGlobalSKTypeface(SKFontManager.Default.MatchCharacter('汉'));
        });
        Init();
    }

    private void Init()
    {
        var bars = new BarModel();

        //显示例图,这里只有设置了位置才会显示
        cartesianChart1.LegendPosition = LiveChartsCore.Measure.LegendPosition.Left;
        cartesianChart1.LegendTextSize = 16;
        cartesianChart1.Series = bars.Series;
        cartesianChart1.XAxes=bars.XAxes;
        cartesianChart1.ZoomMode = LiveChartsCore.Measure.ZoomAndPanMode.X;
        this.Controls.Add(cartesianChart1);
        cartesianChart1.Dock = DockStyle.Fill;
    }
}
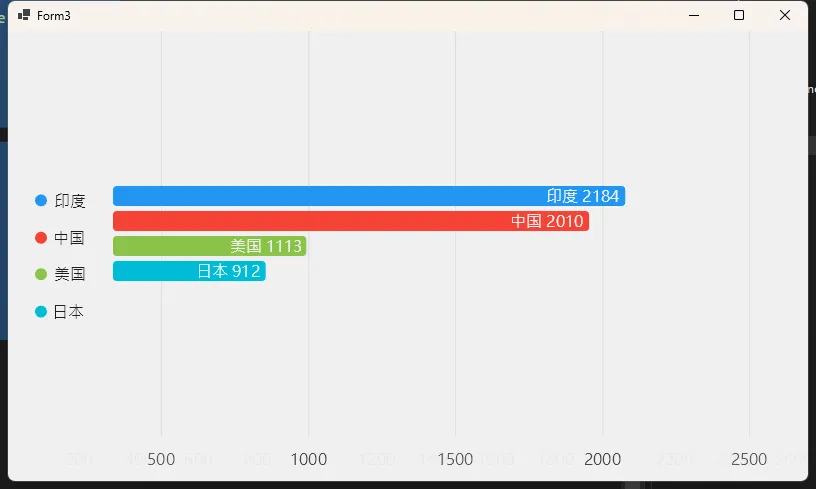
RowSeries 横向柱图
C#public class RBarModel : ObservableObject
{
    private readonly Random _r = new();
    private static readonly (string, double)[] _personNumbers =
    {
        ("中国", 1400),
        ("印度", 1470),
        ("日本", 200),
        ("美国", 400),
     };


    public ISeries[] Series = _personNumbers
        .Select(x => new RowSeries<ObservableValue>
        {
            Values = new[] { new ObservableValue(x.Item2) },
            Name = x.Item1,
            Stroke = null,
            MaxBarWidth = 25,
            DataLabelsPaint = new SolidColorPaint(SKColor.Parse("#f1f1f1")),
            DataLabelsPosition = DataLabelsPosition.End,//尾开始
            DataLabelsTranslate = new LvcPoint(-1, 0),//文字写的地方,从尾开始
            DataLabelsFormatter = point => $"{point.Context.Series.Name} {point.Coordinate.PrimaryValue}"
        })
        .OrderByDescending(x => ((ObservableValue[])x.Values!)[0].Value)
        .ToArray();

    public void RandomIncrement()
    {
        foreach (var item in Series)
        {
            if (item.Values is null) continue;

            var i = ((ObservableValue[])item.Values)[0];
            i.Value += _r.Next(0, 100);
        }

        Series = Series.OrderByDescending(x => ((ObservableValue[])x.Values!)[0].Value).ToArray();
    }

    public Axis[] xAxis =
    {
        new Axis
        {
            SeparatorsPaint = new SolidColorPaint(new SKColor(220, 220, 220))
        }
    };

    public Axis[] yAxis =
    {
        new Axis
        {
            IsVisible = false
        }
    };


}
C#public partial class Form3 : Form
{
    CartesianChart cartesianChart1 = new CartesianChart();

    RBarModel bars = new RBarModel();
    public Form3()
    {
        InitializeComponent();
        //配制全局中文显示,不然会乱码
        LiveCharts.Configure(x =>
        {
            x.HasGlobalSKTypeface(SKFontManager.Default.MatchCharacter('汉'));
        });
        Init();
    }
    private void Init()
    {


        //显示例图,这里只有设置了位置才会显示
        cartesianChart1.LegendPosition = LiveChartsCore.Measure.LegendPosition.Left;
        cartesianChart1.LegendTextSize = 16;
        cartesianChart1.Series = bars.Series;
        cartesianChart1.XAxes = bars.xAxis;
        cartesianChart1.YAxes = bars.yAxis;
        cartesianChart1.ZoomMode = LiveChartsCore.Measure.ZoomAndPanMode.X;
        this.Controls.Add(cartesianChart1);
        cartesianChart1.Dock = DockStyle.Fill;
        UpdateModel();//刷新数据
    }

    public async void UpdateModel()
    {
        while (true)
        {
            bars.RandomIncrement();
            cartesianChart1.Series = bars.Series;
            await Task.Delay(100);
        }
    }
}
本文作者:技术老小子
本文链接:
版权声明:本博客所有文章除特别声明外,均采用 BY-NC-SA 许可协议。转载请注明出处!
目录