目录
摘要
LiveCharts2 中雷达图是一种比较新颖的图表类型,可以将多个维度的数据以交叉的方式展示在同一张图表中,从而更直观地展示数据的关系和特征。在数据分析和展示方面,雷达图有着广泛的应用。
雷达图的核心是坐标轴和指标线,坐标轴分为两个方向,每个方向有两个坐标轴线。每个指标线是一个轴上的交叉线,可以显示多个维度的数据。雷达图的指标线可以自动排序,也可以手动调整顺序。除了常规的雷达图,还有一些特殊的雷达图,如散点雷达图、区域雷达图等等。
雷达图在各个领域都有着广泛的应用,如金融、医疗、市场营销等等。在金融领域,雷达图可以用来展示不同股票的收益率、市盈率、市净率等指标;在医疗领域,雷达图可以用来展示不同药物的副作用、疗效等指标;在市场营销领域,雷达图可以用来展示不同产品的销售额、市场份额等指标。
正文
.net 6下需要单独安装
现在最新版本通过Nuget命令安装
https://www.nuget.org/packages/LiveChartsCore.SkiaSharpView.WinForms 下载最新的版本
NuGet\Install-Package LiveChartsCore.SkiaSharpView.WinForms -Version 2.0.0-beta.860

安装CommunityToolkit.Mvvm.ComponentModel

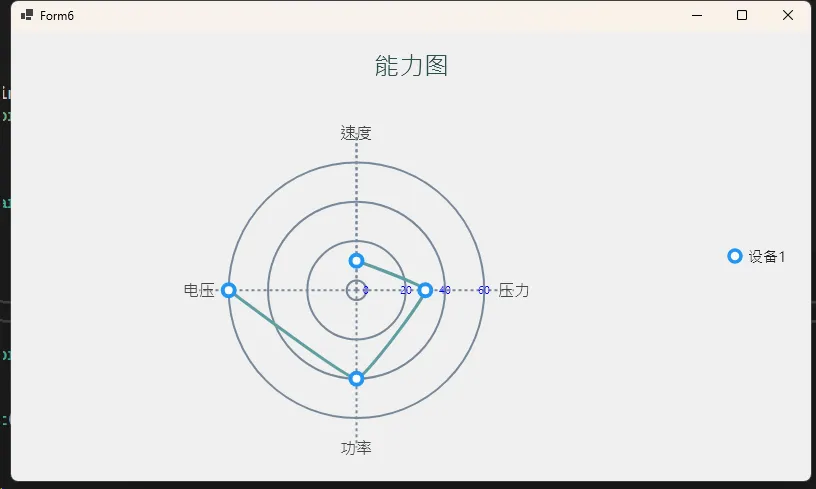
liveChart2 雷达图用的是PolarChart类
这里用的Series 是 PolarLineSeries
C#public class PolarModal : ObservableObject
{

    public PolarModal()
    {
        Series = new List<ISeries>
        {
            new PolarLineSeries<double>
            {
                Name="设备1",
                Values = new double[] { 10,30,40,60 },
                Fill = null,
                IsClosed = false,
                //描边
                Stroke=new SolidColorPaint
                {
                    Color = SKColors.CadetBlue,
                    StrokeThickness = 3
                },
                LineSmoothness = 0.2,

            }
        };
    }

    public IEnumerable<ISeries> Series { get; set; }

    public LabelVisual Title { get; set; } =
     new LabelVisual
     {
         Text = "能力图",
         TextSize = 25,
         Padding = new LiveChartsCore.Drawing.Padding(15),
         Paint = new SolidColorPaint(SKColors.DarkSlateGray)
     };


    public PolarAxis[] AngleAxes = new PolarAxis[]
     {
        new PolarAxis
        {
            Labels = new[] { "速度", "压力", "功率", "电压"},
            MinStep = 1,
            ForceStepToMin = true,
            SeparatorsPaint = new SolidColorPaint(SKColors.LightSlateGray)
            {
                StrokeThickness = 2,
                PathEffect = new DashEffect(new float[] { 3, 3 }) //虚线
            }
        }
     };


    public PolarAxis[] RadiusAxes = new PolarAxis[]
    {
        new PolarAxis
        {
            TextSize = 10,
            LabelsPaint = new SolidColorPaint(SKColors.Blue),
            SeparatorsPaint = new SolidColorPaint(SKColors.LightSlateGray) { StrokeThickness = 2 }
        }
    };
}
C#public partial class Form6 : Form
{
    private PolarChart polarChart;
    PolarModal model = new PolarModal();
    public Form6()
    {
        InitializeComponent();
        //配制全局中文显示,不然会乱码
        LiveCharts.Configure(x =>
        {
            x.HasGlobalSKTypeface(SKFontManager.Default.MatchCharacter('汉'));
        });
        Init();
    }
    public void Init()
    {
        polarChart = new PolarChart
        {
            Series = model.Series,
            Title = model.Title,
            LegendPosition = LiveChartsCore.Measure.LegendPosition.Right,
        };
        polarChart.AngleAxes =model.AngleAxes;//每个能力值
        polarChart.RadiusAxes=model.RadiusAxes;//背景环线
        this.Controls.Add(polarChart);
        polarChart.Dock = DockStyle.Fill;
    }

}
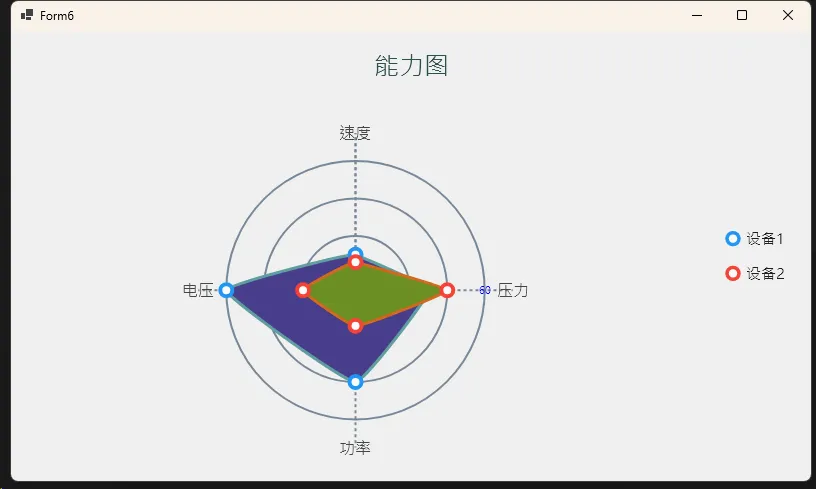
修改一下模型
C#public PolarModal()
{
    Series = new List<ISeries>
    {
        new PolarLineSeries<double>
        {
            Name="设备1",
            Values = new double[] { 10,30,40,60 },
            Fill = new SolidColorPaint
            {
                Color = SKColors.DarkSlateBlue
            },
            IsClosed = true,
            //描边
            Stroke=new SolidColorPaint
            {
                Color = SKColors.CadetBlue,
                StrokeThickness = 3
            },
            LineSmoothness = 0.2,
        },
        new PolarLineSeries<double>
        {
            Name="设备2",
            Values = new double[] { 6,40,10,19 },
            Fill = new SolidColorPaint
            {
                Color = SKColors.OliveDrab
            },
            IsClosed = true,
            //描边
            Stroke=new SolidColorPaint
            {
                Color = SKColors.Chocolate,
                StrokeThickness = 3
            },
            LineSmoothness = 0.2,
        }
    };
}
C#polarChart.EasingFunction = LiveChartsCore.EasingFunctions.BounceOut;//增加动画效果
本文作者:技术老小子
本文链接:
版权声明:本博客所有文章除特别声明外,均采用 BY-NC-SA 许可协议。转载请注明出处!
目录