目录
摘要
Bubble Plot(气泡图)是一种数据可视化图表,用于显示三个变量之间的关系。它通过在二维平面上绘制圆形气泡来表示数据点,其中每个气泡的位置由两个变量确定,而气泡的大小则表示第三个变量的值。
正文
气泡图常用于以下应用场景:
- 数据比较:气泡图可以用于比较不同组或类别之间的数据。例如,可以使用气泡图来比较不同城市的人口数量,其中每个气泡表示一个城市,其位置表示城市的经纬度,而气泡的大小表示城市的人口数量。
- 趋势分析:气泡图可以用于显示随时间变化的数据趋势。例如,可以使用气泡图来显示不同年份的国家 GDP,其中每个气泡表示一个国家,其位置表示国家的经济指标,而气泡的大小表示国家的 GDP。
- 数据聚类:气泡图可以用于显示数据点的聚类或分组。例如,可以使用气泡图来显示不同产品的销售额和利润,其中每个气泡表示一个产品,其位置表示销售额和利润的值,而气泡的大小表示产品的销售量。
- 地理可视化:气泡图可以用于地理数据的可视化。例如,可以使用气泡图来显示不同城市或地区的某种属性值,其中每个气泡表示一个城市或地区,其位置表示地理坐标,而气泡的大小表示属性值的大小。
nuget 安装ScottPlot4.1版本。
气泡图
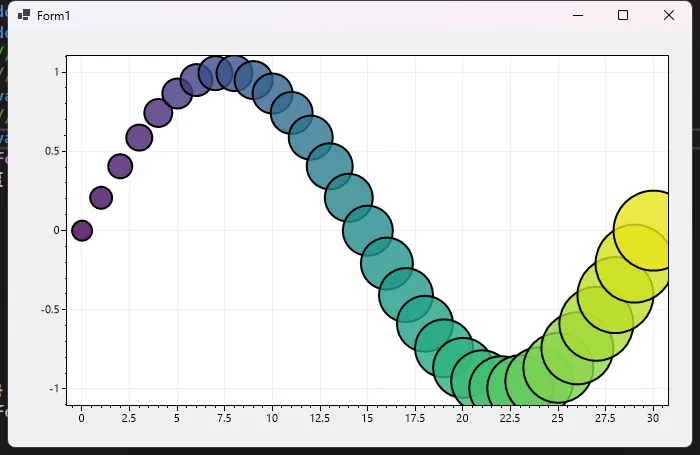
C#private void Form1_Load(object sender, EventArgs e)
{
    var plot = formsPlot1.Plot;
    double[] xs = DataGen.Consecutive(31);
    double[] ys = DataGen.Sin(31);
    //ScottPlot 绘图库中的一个预定义颜色映射(colormap)
    //用于在绘图中应用颜色渐变。
    var colormap = ScottPlot.Drawing.Colormap.Viridis;
    //创建气泡图
    var myBubblePlot = plot.AddBubblePlot();
    for (int i = 0; i < xs.Length; i++)
    {
        double fraction = (double)i / xs.Length;
        myBubblePlot.Add(
            x: xs[i],
            y: ys[i],
            radius: 10 + i,
            fillColor: colormap.GetColor(fraction, alpha: .8),
            edgeColor: System.Drawing.Color.Black,
            edgeWidth: 2
        );
    }
    formsPlot1.Refresh();
}
气泡散点图
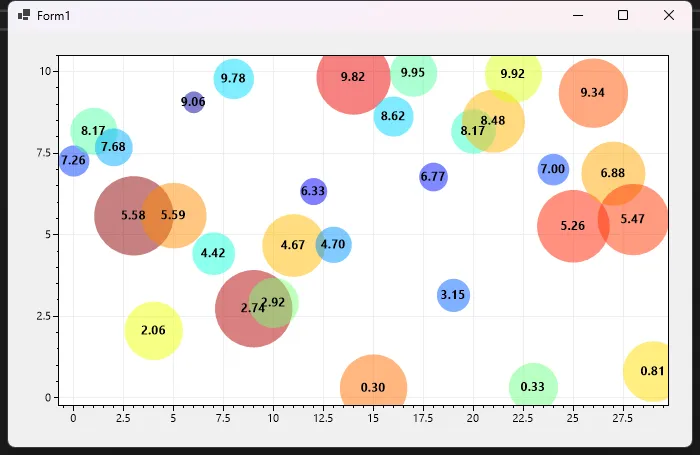
C#private void Form1_Load(object sender, EventArgs e)
{
    var plot = formsPlot1.Plot;

    Random rand = new(0);
    int pointCount = 30;
    //生成一个连续的数字序列
    double[] xs = DataGen.Consecutive(pointCount);
    double[] ys = DataGen.Random(rand, pointCount, 10);
    string[] labels = ys.Select(x => x.ToString("N2")).ToArray();
    var labelFont = new ScottPlot.Drawing.Font
    {
        Bold = true,
        Color = Color.Black,
        Alignment = Alignment.MiddleCenter
    };

    var myBubblePlot = plot.AddBubblePlot();
    for (int i = 0; i < xs.Length; i++)
    {
        //随机大小和较小的气泡
        double randomValue = rand.NextDouble();
        double bubbleSize = randomValue * 30 + 10;
        Color bubbleColor = ScottPlot.Drawing.Colormap.Jet.GetColor(randomValue, .5);

        myBubblePlot.Add(
            x: xs[i],
            y: ys[i],
            radius: bubbleSize,
            fillColor: bubbleColor,
            edgeColor: Color.Transparent,
            edgeWidth: 1
        );
        //添上文字
        plot.AddText(labels[i], xs[i], ys[i], labelFont);
    }


    formsPlot1.Refresh();
}
本文作者:技术老小子
本文链接:
版权声明:本博客所有文章除特别声明外,均采用 BY-NC-SA 许可协议。转载请注明出处!
目录