
作为一名资深C#开发者,我在代码审查中遇到过这样的场景:新入职的同事将ProductType、FixtureType、FixtureTemplate三个类全部写在了ProjectType.cs文件里。技术总监看后直接炸了:"这是什么鬼?一个文件一个类,这是基本规范!"
但事实真的是这样吗?最近在Reddit上有一个关于"C#是否应该将多个类放在一个文件中"的热门讨论,收获了800多个点赞和激烈的辩论。有趣的是,支持和反对的开发者几乎各占一半!
这个看似简单的问题,背后却隐藏着团队协作、代码维护、性能优化等多个层面的考量。今天我们就来深入探讨这个争议话题,给出实用的解决方案。
💡 问题深度分析
🔍 为什么会有这个争议?
这个争议的根源可以追溯到1995年Java的设计哲学。当时IDE和静态分析工具还不成熟,Java强制要求一个文件只能有一个public类,文件名必须与类名一致。这个30年前的设计原则,至今仍在影响着我们的编程习惯。
但现在情况不同了:
- 现代IDE拥有强大的导航功能(Ctrl+T快速搜索、F12跳转定义)
- 静态分析工具可以轻松定位任何类
- 编译器和运行时对文件组织方式完全无感
🎭 两个阵营的核心观点
支持派(一个文件多个类)认为:
- 紧密相关的小类放在一起更有逻辑性
- 减少文件数量,降低项目复杂度
- 提高代码的局部性(Locality of Behavior)
我个人习惯这样干 ,不过随着项目的不断CR,维护性也是不断下降,其实也就是人懒:
反对派(一个文件一个类)认为:
- 便于团队协作,减少合并冲突
- 文件命名和组织更加清晰
- 符合单一职责原则(SRP)
🛠️ 实战解决方案
方案一:基于关联度的分组策略
C#// 📁 ProductModels.cs - 推荐做法
namespace ECommerce.Models
{
    // 主要的产品类
    public class Product
    {
        public int Id { get; set; }
        public string Name { get; set; }
        public ProductType Type { get; set; }
        public List<ProductAttribute> Attributes { get; set; }
    }

    // 产品类型枚举 - 仅被Product使用
    public enum ProductType
    {
        Electronics,
        Clothing,
        Books
    }

    // 产品属性类 - 仅被Product使用
    public class ProductAttribute
    {
        public string Name { get; set; }
        public string Value { get; set; }
    }
}
作为一名资深的C#开发者,你是否在转向Java时被一些"看似相同实则不同"的语法细节困扰?变量声明方式的差异、运算符行为的微妙变化、控制流语句的细微区别——这些看似简单的基础语法,往往成为C#开发者学习Java路上的第一道坎。
本文将从基本数据类型、变量声明、运算符和控制流语句四个维度,为你详细对比Java与C#的语法差异,每个知识点都配有实战代码示例和踩坑提醒。让你在15分钟内掌握Java语法基础,告别转型初期的语法迷茫!
🔢 基本数据类型:细节决定成败
问题分析:数据类型看似相同,实则暗藏玄机
许多C#开发者初学Java时,看到int、double、boolean这些熟悉的关键字,以为可以无缝切换。然而,在数据范围、默认值、装箱拆箱等方面,两种语言存在重要差异。
解决方案:掌握核心差异点
💡 方案一:整型数据类型对比
Java代码示例:
Javapackage org.example;
public class DataTypeComparison{
public static void main(String[] args) {
// Java中的基本整型
byte b = 127;
short s = 32767;
int i = 2147483647;
long l = 9223372036854775807L; // 注意L后缀
// 字面量表示
int hex = 0xFF; // 十六进制
int binary = 0b1010; // 二进制(Java 7+)
int underScore = 1_000_000; // 下划线分隔(Java 7+)
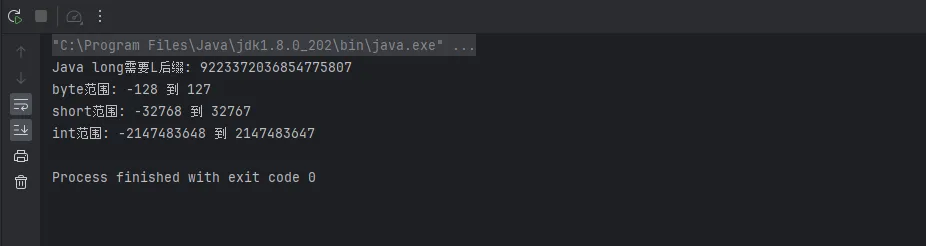
System.out.println("Java long需要L后缀: " + l);
//输出byte最大,最小值
System.out.println("byte范围: " + Byte.MIN_VALUE + " 到 " + Byte.MAX_VALUE);
//输出short最大,最小值
System.out.println("short范围: " + Short.MIN_VALUE + " 到 " + Short.MAX_VALUE);
//输出int最大,最小值
System.out.println("int范围: " + Integer.MIN_VALUE + " 到 " + Integer.MAX_VALUE);
}
}
在工业制造、设备管理等业务场景中,我们经常遇到这样的痛点:设备有上下级关系、工艺流程呈树状结构,如何用SQL优雅地查询出完整的层级关系?
传统的表连接查询面对多层嵌套时显得力不从心,递归存储过程又过于复杂。今天就来揭秘SQL Server的CTE递归查询这个利器,让你轻松处理任何深度的树形数据结构!
无论你是要查询某个设备下的所有子设备,还是要追溯工艺流程的完整路径,本文将通过实战案例,让你彻底掌握CTE递归查询的精髓。
🔍 问题分析:树形数据查询的三大痛点
痛点1:层级深度不确定
在实际业务中,设备层级可能有3层、5层,甚至更深。用传统JOIN方式需要写N个表连接,代码冗长且不灵活。
痛点2:向上向下查询需求并存
既要能从叶子节点向上追溯到根节点,又要能从根节点向下展开所有子节点,单一查询方式无法满足。
痛点3:性能与可读性难以兼顾
递归存储过程性能好但代码复杂,简单查询可读性强但性能差,需要找到平衡点。
🛠️ 解决方案:CTE递归查询的5大实战技巧
📋 数据准备:构建测试环境
首先创建设备层级表和工艺流程表:
SQL-- 创建设备层级表
CREATE TABLE Equipment (
    EquipmentID INT PRIMARY KEY,
    EquipmentName NVARCHAR(100),
    ParentID INT,
    Level INT,
    CreateDate DATETIME DEFAULT GETDATE()
);

-- 插入测试数据
INSERT INTO Equipment VALUES
(1, '生产线A', NULL, 1, '2024-01-01'),
(2, '工作站A1', 1, 2, '2024-01-02'),
(3, '工作站A2', 1, 2, '2024-01-03'),
(4, '设备A1-1', 2, 3, '2024-01-04'),
(5, '设备A1-2', 2, 3, '2024-01-05'),
(6, '传感器A1-1-1', 4, 4, '2024-01-06'),
(7, '传感器A1-1-2', 4, 4, '2024-01-07');

-- 创建工艺流程表
CREATE TABLE ProcessFlow (
    ProcessID INT PRIMARY KEY,
    ProcessName NVARCHAR(100),
    ParentProcessID INT,
    Sequence INT,
    Duration INT -- 工序耗时(分钟)
);

-- 插入工艺流程数据
INSERT INTO ProcessFlow VALUES
(1, '产品制造', NULL, 1, 0),
(2, '原料准备', 1, 1, 30),
(3, '加工处理', 1, 2, 60),
(4, '质量检测', 1, 3, 20),
(5, '物料投入', 2, 1, 10),
(6, '预处理', 2, 2, 20),
(7, '粗加工', 3, 1, 30),
(8, '精加工', 3, 2, 30);
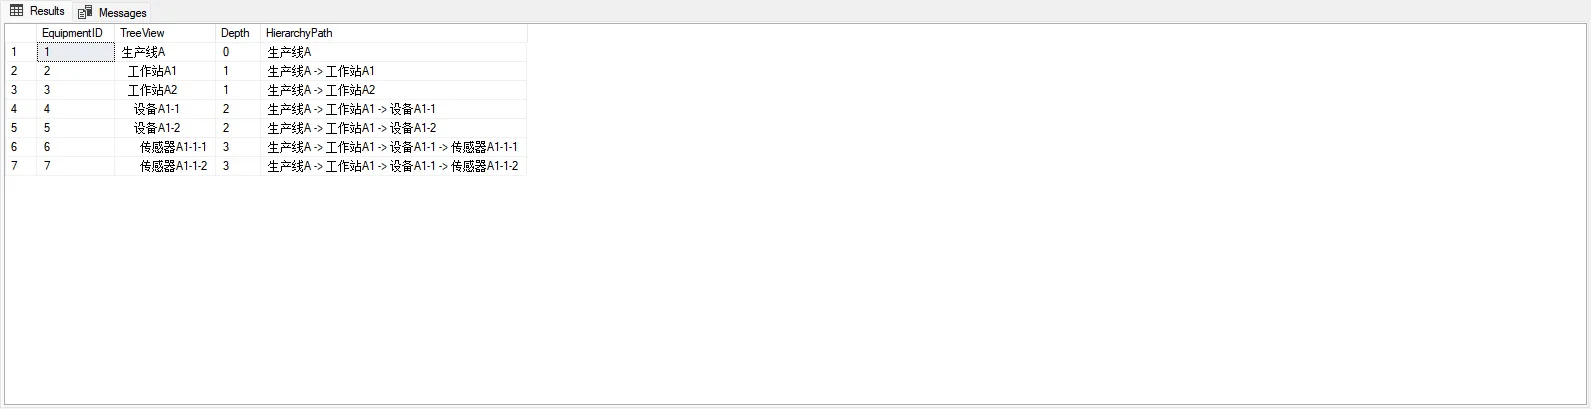
🔥 技巧一:向下递归查询子设备
场景:查询某个设备及其所有下级设备
SQL-- 查询设备ID=1的所有下级设备
WITH EquipmentHierarchy AS (
    -- 锚点:找到起始设备
    SELECT
        EquipmentID,
        EquipmentName,
        ParentID,
        Level,
        0 as Depth,
        CAST(EquipmentName AS NVARCHAR(500)) as HierarchyPath
    FROM Equipment
    WHERE EquipmentID = 1

    UNION ALL

    -- 递归:找到所有子设备
    SELECT
        e.EquipmentID,
        e.EquipmentName,
        e.ParentID,
        e.Level,
        eh.Depth + 1,
        CAST(eh.HierarchyPath + ' -> ' + e.EquipmentName AS NVARCHAR(500))
    FROM Equipment e
    INNER JOIN EquipmentHierarchy eh ON e.ParentID = eh.EquipmentID
)
SELECT
    EquipmentID,
    REPLICATE('  ', Depth) + EquipmentName as TreeView,
    Depth,
    HierarchyPath
FROM EquipmentHierarchy
ORDER BY Depth, EquipmentID;
在C#图形编程领域,SkiaSharp作为.NET平台上的强大2D图形库,为开发者提供了丰富的图形处理能力。而旋转变换作为基础且常用的图形操作,在UI设计、动画效果和图像处理中扮演着重要角色。本文将深入探讨SkiaSharp中的旋转变换原理及实现方法,通过详细的代码示例帮助你掌握这一技能。
SkiaSharp简介
SkiaSharp是Google Skia图形引擎的C#/.NET绑定,提供跨平台的2D图形API。它被广泛应用于Xamarin.Forms、.NET MAUI、WPF等平台的图形渲染,支持矢量图形、文本渲染、图像处理等功能。
使用SkiaSharp需要安装以下NuGet包:
C#Install-Package SkiaSharp
Install-Package SkiaSharp.Views.WindowsForms
旋转变换基础知识
什么是旋转变换?
旋转变换是指将图形或图像围绕某个点按照指定角度进行旋转的过程。在SkiaSharp中,旋转通常围绕指定的原点进行,角度以顺时针方向为正。
数学原理
旋转变换在数学上通过旋转矩阵实现,这一操作可表示为:
Pythonx' = x·cos(θ) - y·sin(θ)
y' = x·sin(θ) + y·cos(θ)
其中,(x, y)是原始坐标,(x', y')是旋转后的坐标,θ是旋转角度。
SkiaSharp中实现旋转变换
基本方法:使用Canvas.RotateDegrees()
最直接的旋转方法是使用SKCanvas的RotateDegrees()或RotateRadians()方法:
C#using SkiaSharp.Views.Desktop;
using SkiaSharp;

namespace AppRotate
{
    public partial class Form1 : Form
    {
        public Form1()
        {
            InitializeComponent();
            SKControl skControl = new SKControl();
            skControl.Dock = DockStyle.Fill;
            skControl.PaintSurface += OnPaintSurface;
            Controls.Add(skControl);
        }
        private void OnPaintSurface(object sender, SKPaintSurfaceEventArgs e)
        {
            // 获取画布
            SKCanvas canvas = e.Surface.Canvas;

            // 清除背景
            canvas.Clear(SKColors.White);

            // 创建画笔
            using SKPaint paint = new SKPaint
            {
                Color = SKColors.Blue,
                StrokeWidth = 5,
                IsAntialias = true,
                Style = SKPaintStyle.Stroke
            };

            // 保存当前画布状态
            canvas.Save();

            // 执行旋转变换 (45度,围绕点(100, 100))
            canvas.Translate(100, 100);  // 移动原点到旋转中心
            canvas.RotateDegrees(45);    // 旋转45度
            canvas.Translate(-100, -100); // 移回原来位置

            // 绘制一个矩形
            canvas.DrawRect(50, 50, 100, 100, paint);

            // 恢复画布状态
            canvas.Restore();

            // 使用不同颜色绘制一个未旋转的矩形作为对比
            using SKPaint paint2 = new SKPaint
            {
                Color = SKColors.Red,
                StrokeWidth = 5,
                IsAntialias = true,
                Style = SKPaintStyle.Stroke
            };
            canvas.DrawRect(200, 50, 100, 100, paint2);
        }
    }
}

还在为复杂的数据列表展示而头疼吗?每次需要显示表格数据时都要重新造轮子?作为WinForms开发中的核心控件,ListView不仅能优雅地处理各种列表展示需求,更是构建专业用户界面的基石。
许多C#开发者在使用ListView时往往停留在基础应用层面,错失了它的强大功能。本文将从实战角度出发,带你深度掌握ListView的高级特性,让你的应用界面瞬间专业起来!
🎯 ListView核心能力解析
📊 五种视图模式全攻略
ListView提供了5种灵活的显示模式,每种都有其独特的应用场景:
- LargeIcon:适合文件管理器、图片库等场景
- SmallIcon:适合紧凑型列表显示
- List:经典的垂直列表布局
- Details:表格形式,企业应用首选
- Tile:现代化的磁贴显示