还在为如何优雅地组织复杂的用户界面而头疼吗?当用户面对密密麻麻的控件时,是否经常感到迷茫和困惑?今天我们就来聊聊WinForms中的两个界面"整理大师"——TabControl和GroupBox控件。这两个控件不仅能让你的应用界面瞬间变得清晰有序,更能显著提升用户体验。本文将深入剖析这两个控件的核心用法,并分享一些实战中的最佳实践和踩坑经验。
🎯 为什么界面组织这么重要?
在实际开发中,我们经常遇到这些问题:
- 信息过载:一个窗体塞满各种控件,用户不知道从哪里开始
- 逻辑混乱:相关功能分散在界面各处,操作效率低下
- 视觉疲劳:缺乏层次感的界面让用户产生抵触情绪
这时候,TabControl和GroupBox就是我们的救星!
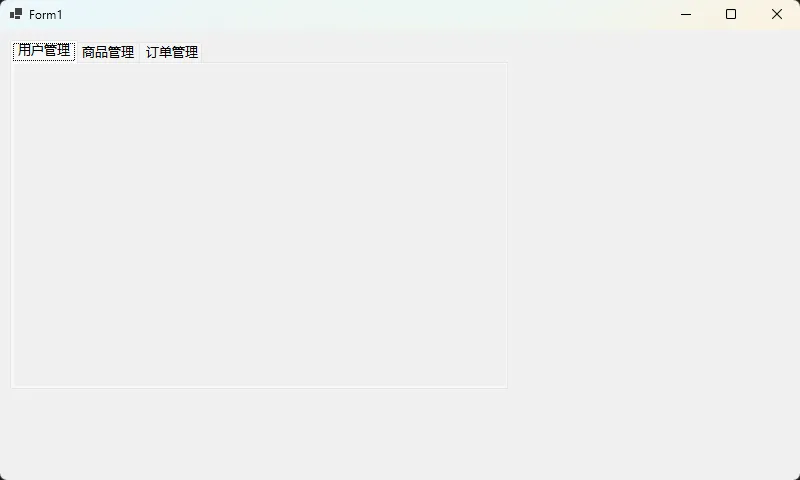
🔥 TabControl:多页面管理的利器
核心属性掌握
TabControl最强大的地方在于它能在有限的空间内展示无限的可能:
C#namespace AppWinformTabControlAndGroupBox
{
    public partial class Form1 : Form
    {
        public Form1()
        {
            InitializeComponent();
            var tabControl = new TabControl
            {
                Location = new Point(10, 10),
                Size = new Size(500, 350),
                Alignment = TabAlignment.Top,  // 标签位置
                Multiline = false,             // 单行显示标签
                Appearance = TabAppearance.Normal
            };

            // 动态添加标签页
            var userTab = new TabPage("用户管理");
            var productTab = new TabPage("商品管理");
            var orderTab = new TabPage("订单管理");

            tabControl.TabPages.AddRange(new[] { userTab, productTab, orderTab });

            this.Controls.Add(tabControl);
        }
    }
}
前言:在AI浪潮席卷各行各业的今天,你是否想过如何将GPT的强大能力集成到自己的C#应用中?传统的HTTP调用方式不仅繁琐,还难以实现复杂的业务逻辑。
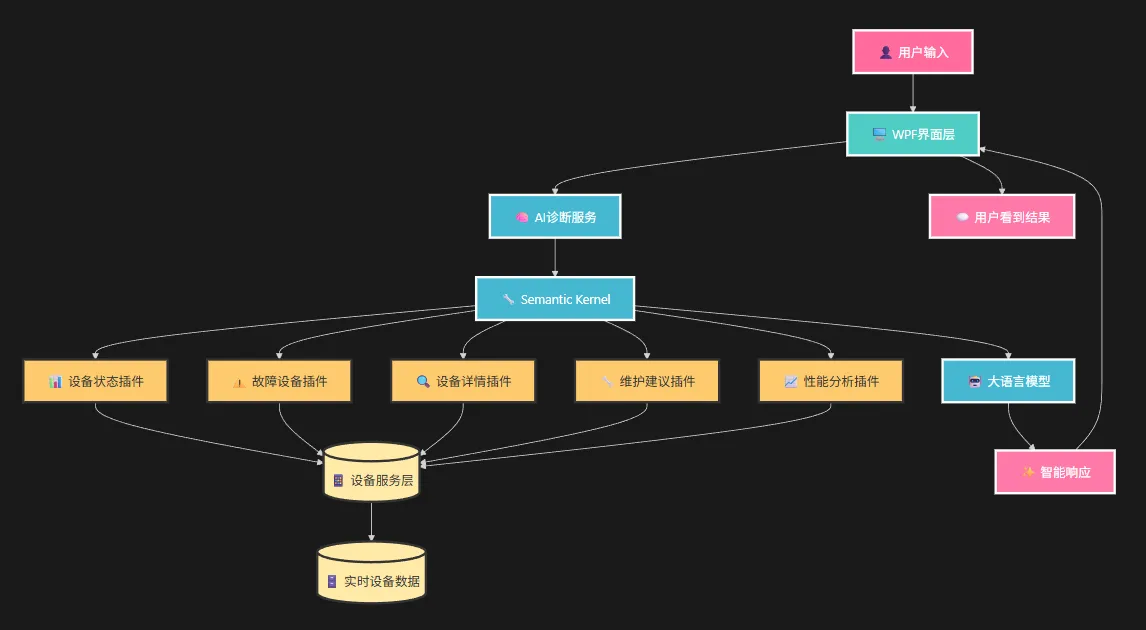
今天,我将通过一个智能设备诊断系统的案例,手把手教你使用Microsoft Semantic Kernel框架,轻松构建一个具备专业诊断能力的AI助手。这不是简单的聊天机器人,而是能够调用业务数据、执行复杂分析的AI应用!算是抛转引玉。
🎯 痛点分析:传统AI集成的三大难题
核心挑战
在企业应用中集成AI功能时,开发者常常遇到:
- 数据孤岛:AI无法直接访问业务系统数据
- 上下文丢失:对话缺乏业务背景和专业知识
- 功能单一:只能简单问答,无法执行具体业务操作
解决方案预览
通过Semantic Kernel + 函数调用,我们将实现:
- 智能插件系统:AI可以主动调用业务函数获取实时数据
- 专业知识注入:为AI提供领域专家级的诊断能力
- 上下文记忆:保持完整的对话历史和业务状态
💐 设计流程
在现代工业4.0时代,数据采集系统已成为企业数字化转型的核心基础设施。无论是工厂生产线的传感器监控、物联网设备的状态采集,还是金融系统的实时交易数据处理,一个高效、稳定的数据采集系统都至关重要。
然而,许多C#开发者在构建此类系统时常常遇到这些痛点:数据处理延迟高、内存占用过大、异常数据处理不当、缺乏有效的质量控制机制。本文将通过一个完整的实战案例,教你如何用C#构建一个专业级的数据采集系统,彻底解决这些技术难题。
🎯 系统架构设计:三层数据流水线
核心架构思路
我们采用生产者-消费者模式结合Channel异步通信,构建了一个三层数据处理管道:
Markdown数据生成层 → 数据处理层 → 数据聚合层 → UI展示层
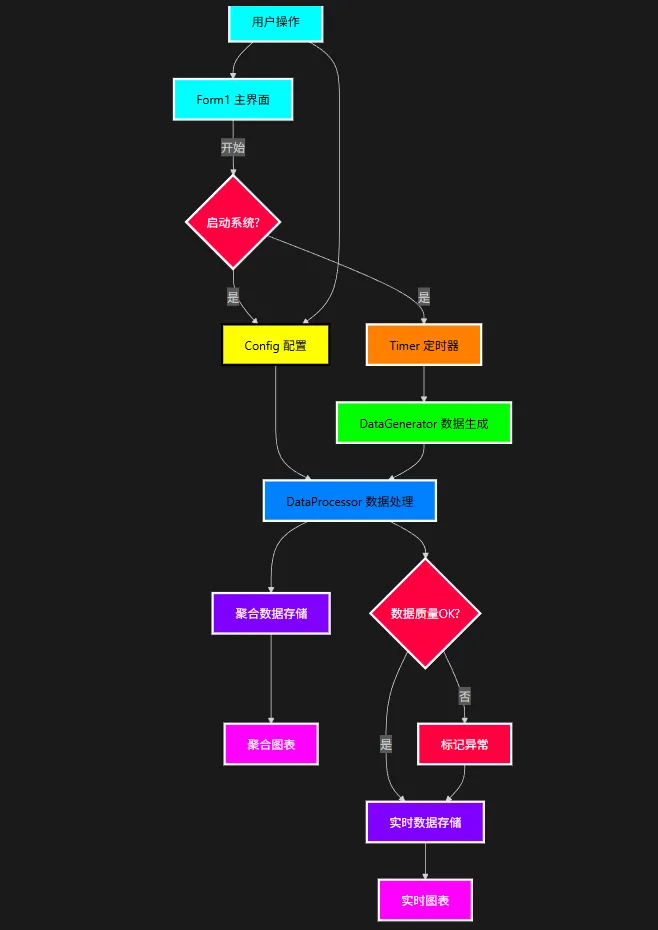
这种设计的优势在于:
- ✅ 解耦性强:各层职责单一,便于维护和扩展
- ✅ 性能优异:基于Channel的异步处理,支持高并发
- ✅ 容错能力:单层故障不会影响整个系统运行
你是否遇到过这样的开发痛点:内网环境无法访问外部API,需要通过代理进行调试?或者需要监控团队应用的HTTP请求流量?最近在.NET技术群里,很多开发者都在讨论一个共同问题:"如何快速实现一个灵活可控的HTTP代理服务器?"
据不完全统计,超过70%的企业级应用都需要代理服务器来处理网络请求,但市面上的代理工具要么功能单一,要么配置复杂。今天就带你用C#从零开始,10分钟内搭建一个功能完整的HTTP代理服务器,让你彻底掌握网络代理的核心原理和实现技巧!
💡 为什么要自己开发HTTP代理服务器?
🔍 常见应用场景分析
在实际C#开发中,我们经常遇到这些痛点:
1. 开发环境限制:内网环境无法直接访问外部API
2. 请求监控需求:需要记录和分析HTTP请求数据
3. 访问控制:对特定域名或IP进行过滤
4. 性能优化:缓存频繁请求的响应数据
5. 负载均衡:将请求分发到不同的后端服务器
🛠️ 核心技术方案选型
| 方案 | 优势 | 劣势 | 适用场景 |
|---|---|---|---|
| HttpListener | 简单易用 | 功能有限 | 轻量级代理 |
| Socket编程 | 性能最佳 | 开发复杂 | 高性能场景 |
| ASP.NET Core | 功能丰富 | 资源占用大 | 企业级应用 |
想象一下这个场景:你正在开发一个关键项目,突然网络变慢,但你不知道是哪个应用在偷偷占用带宽。或者你是运维工程师,需要实时监控服务器的网络流量状况。市面上的网络监控工具要么功能过于复杂,要么界面丑陋过时。
今天,我将带你用C#从零构建一个专业级网络流量监控工具,不仅界面美观,功能强大,而且完全可定制。这个项目将帮你掌握网络编程、数据可视化、性能优化等多个技术要点,突然发现正式版的ScottPlot 5.0又变了。。。晕死。
🎯 项目功能预览
我们要实现的功能包括:
- ✅ 实时监控上传/下载速度
- ✅ 动态图表显示历史数据
- ✅ 多网卡接口选择
- ✅ 网络统计信息展示
- ✅ 启动/停止监控控制
🔧 核心技术栈分析
🛠️ 必备NuGet包
XML<!-- ScottPlot:强大的数据可视化库 -->
<PackageReference Include="ScottPlot.WinForms" Version="5.0.0" />
🎨 关键命名空间
C#using ScottPlot;                        // 图表核心功能
using ScottPlot.WinForms;              // WinForms集成
using System.Net.NetworkInformation;    // 网络接口操作
using Timer = System.Windows.Forms.Timer; // 定时器
💡 核心架构设计
🏗️ 数据结构设计
C#public partial class Form1 : Form
{
    // 定时器和网络接口
    private Timer updateTimer;
    private NetworkInterface selectedInterface;
    private List<NetworkInterface> networkInterfaces;

    // 历史数据存储
    private List<double> downloadHistory;
    private List<double> uploadHistory;
    private List<DateTime> timeHistory;

    // 基准数据用于计算差值
    private long lastBytesReceived;
    private long lastBytesSent;
    private DateTime lastUpdateTime;

    // 数据点控制
    private int maxHistoryPoints = 60; // 保留60个数据点(1分钟历史)

    // ScottPlot 图表对象
    private ScottPlot.Plottables.Scatter downloadPlot;
    private ScottPlot.Plottables.Scatter uploadPlot;
}