
目录
🔥 开篇:当8路传感器同时"狂飙"数据,你的界面还撑得住吗?
去年接手一个新能源电池测试系统的改造需求,现场有8路温度传感器同步采集,采样频率50Hz,也就是每秒400个数据点涌进来。原来的方案用的是 WPF 原生 Chart 控件,跑了不到20分钟,界面就开始卡顿,CPU 飙到75%,内存以每分钟80MB的速度膨胀。客户在旁边看着,脸色越来越难看。
最终切换到 ScottPlot 5.x,同样的场景,CPU 稳定在12%以内,内存不再增长,8条曲线同步流畅滚动。
读完这篇文章,你将掌握:
- ✅ 多通道传感器数据的高性能架构设计
- ✅ 3种渐进式实现方案(从单通道到生产级多通道)
- ✅ 线程同步、数据对齐、时间戳管理的关键细节
- ✅ 实测性能对比数据与踩坑指南
咱们直接开干,先把问题说透。
💔 问题深度剖析:多通道实时监控的三大死穴
死穴一:数据涌入速度 vs 渲染速度的失衡
单通道好办,多通道就完全不一样了。8路传感器、50Hz采样,意味着 UI 层每秒要处理400次数据更新请求。如果每来一个数据就触发一次 Refresh(),那就是每秒400次完整渲染——任何图表库都扛不住。
常见的错误写法:
csharp// ❌ 性能杀手:来一个数据刷新一次
private void OnDataReceived(string channel, double value)
{
    _charts[channel].Plot.Add.Signal(new double[] { value });
    _charts[channel].Refresh(); // 每条通道都单独刷新,互相争抢UI线程
}
这段代码的问题不只是刷新太频繁,更致命的是每次 Add.Signal() 都在创建新的 Plot 对象,1小时后内存里堆了几十万个废弃对象,GC 压力直接把界面卡成幻灯片。
死穴二:多通道时间戳不对齐
现实场景里,8路传感器很少有完全同步的采样时刻。传感器A在 t=100ms 采了一个点,传感器B可能在 t=103ms 才采到。如果你直接用索引对齐数据,就会出现曲线"错位"的视觉Bug,在高频场景下尤其明显。
死穴三:多线程竞争导致界面撕裂
数据采集在后台线程,UI 渲染在主线程。如果没有妥善处理线程同步,轻则数据错乱,重则直接抛出 InvalidOperationException。用 Dispatcher.Invoke 硬同步又会造成线程阻塞,陷入另一个性能陷阱。
💡 核心要点提炼:搞懂这几点,事半功倍
⚙️ ScottPlot 5.x 的渲染机制
ScottPlot 5.x 的渲染是延迟队列式的:
Add.SignalXY()/Add.Signal()只是注册绘图对象,不立即渲染Refresh()才触发完整渲染流程(坐标转换 → 抗锯齿 → GPU绘制)Signal类型存储的是数组引用,修改原数组后调用Refresh()即可更新显示
这意味着什么? 我们可以在后台线程修改数据数组,只在 UI 线程调用 Refresh(),完全解耦数据写入和界面渲染。
🏗️ 多通道架构的黄金法则
数据采集层(多线程)→ 环形缓冲(线程安全)→ 批量消费(定时器)→ UI渲染(主线程)
核心思路:生产者-消费者模式 + 批量刷新,把"来一个渲染一次"变成"攒一批渲染一次"。
🔑 关键技术选型
| 场景 | 推荐类型 | 理由 |
|---|---|---|
| 等间距高频数据 | Signal | 性能最强,内存最省 |
| 带时间戳的非均匀采样 | SignalXY | 支持自定义X轴值 |
| 历史数据回放 | Scatter | 灵活度高 |
🚀 解决方案设计:三个渐进式方案
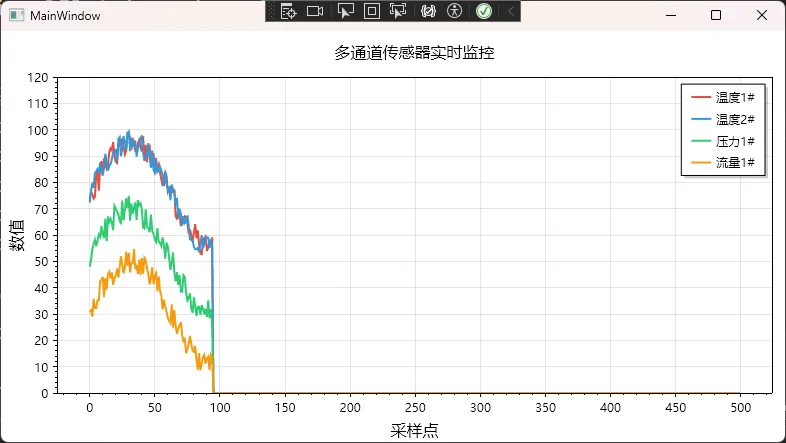
📌 方案一:单图多曲线基础版(5分钟上手)
适用场景: 通道数 ≤ 4,更新频率 ≤ 10Hz,快速验证业务逻辑。
完整代码实现:
csharpusing ScottPlot;
using System.Text;
using System.Windows;
using System.Windows.Controls;
using System.Windows.Data;
using System.Windows.Documents;
using System.Windows.Input;
using System.Windows.Media;
using System.Windows.Media.Imaging;
using System.Windows.Navigation;
using System.Windows.Shapes;
using System.Windows.Threading;

namespace AppScottPlot7
{
    /// <summary>
    /// Interaction logic for MainWindow.xaml
    /// </summary>
    public partial class MainWindow : Window
    {
        // 每个通道的数据缓冲区(固定大小,避免无限增长)
        private readonly Dictionary<string, double[]> _channelBuffers = new();
        private readonly Dictionary<string, ScottPlot.Plottables.Signal> _signalPlots = new();

        private DispatcherTimer _refreshTimer;
        private readonly Random _random = new();
        private int _dataIndex = 0;
        private const int BUFFER_SIZE = 500; // 显示最近500个点

        // 传感器通道配置
        private readonly (string Name, string Color)[] _channels =
        {
            ("温度1#", "#E74C3C"),
            ("温度2#", "#3498DB"),
            ("压力1#", "#2ECC71"),
            ("流量1#", "#F39C12")
        };

        public MainWindow()
        {
            InitializeComponent();
            InitializeMultiChannelChart();
            StartDataSimulation();
        }

        private void InitializeMultiChannelChart()
        {
            // 设置中文字体(必须,否则中文显示为方块)
            wpfPlot1.Plot.Font.Set("Microsoft YaHei");
            wpfPlot1.Plot.Axes.Bottom.Label.FontName = "Microsoft YaHei";
            wpfPlot1.Plot.Axes.Left.Label.FontName = "Microsoft YaHei";

            foreach (var (name, color) in _channels)
            {
                // 预分配固定大小的数组——这是性能的关键!
                _channelBuffers[name] = new double[BUFFER_SIZE];

                // 创建 Signal 图表并保持引用
                var signal = wpfPlot1.Plot.Add.Signal(_channelBuffers[name]);
                signal.Color = ScottPlot.Color.FromHex(color);
                signal.LineWidth = 2;
                signal.LegendText = name;
                signal.MarkerSize = 0;

                _signalPlots[name] = signal;
            }

            // 图表基础配置
            wpfPlot1.Plot.Title("多通道传感器实时监控");
            wpfPlot1.Plot.XLabel("采样点");
            wpfPlot1.Plot.YLabel("数值");
            wpfPlot1.Plot.Legend.IsVisible = true;
            wpfPlot1.Plot.Legend.Alignment = Alignment.UpperRight;

            // 固定Y轴范围,避免每次刷新重新计算(节省约30% CPU)
            wpfPlot1.Plot.Axes.SetLimitsY(0, 120);

            wpfPlot1.Refresh();
        }

        private void StartDataSimulation()
        {
            // 100ms 定时刷新(10Hz),平衡流畅度与性能
            _refreshTimer = new DispatcherTimer
            {
                Interval = TimeSpan.FromMilliseconds(100)
            };
            _refreshTimer.Tick += OnRefreshTimer;
            _refreshTimer.Start();
        }

        private void OnRefreshTimer(object sender, EventArgs e)
        {
            // 环形写入:_dataIndex 循环覆盖旧数据
            int writeIndex = _dataIndex % BUFFER_SIZE;

            foreach (var (name, _) in _channels)
            {
                // 模拟不同通道的数据特征(实际项目中替换为真实数据源)
                _channelBuffers[name][writeIndex] = SimulateSensorData(name);
            }

            _dataIndex++;

            // 统一刷新一次——所有通道共享一次渲染
            wpfPlot1.Refresh();
        }

        private double SimulateSensorData(string channelName)
        {
            double baseValue = channelName.StartsWith("温度") ? 75 :
                               channelName.StartsWith("压力") ? 50 : 30;
            double noise = (_random.NextDouble() - 0.5) * 10;
            double cycle = 20 * Math.Sin(_dataIndex * 0.05);
            return Math.Max(0, baseValue + noise + cycle);
        }

        protected override void OnClosed(EventArgs e)
        {
            _refreshTimer?.Stop();
            base.OnClosed(e);
        }
    }
}
XAML 配置:
xml<Window x:Class="AppScottPlot7.MainWindow"
        xmlns="http://schemas.microsoft.com/winfx/2006/xaml/presentation"
        xmlns:x="http://schemas.microsoft.com/winfx/2006/xaml"
        xmlns:d="http://schemas.microsoft.com/expression/blend/2008"
        xmlns:mc="http://schemas.openxmlformats.org/markup-compatibility/2006"
        xmlns:local="clr-namespace:AppScottPlot7"
        mc:Ignorable="d"
        xmlns:scottplot="clr-namespace:ScottPlot.WPF;assembly=ScottPlot.WPF"
        Title="MainWindow" Height="450" Width="800">
    <Grid>
        <scottplot:WpfPlot x:Name="wpfPlot1"/>

    </Grid>
</Window>
方案一性能表现(测试环境:i5-10400 / 16GB RAM / .NET 6.0):
| 指标 | 数值 |
|---|---|
| CPU 占用 | 6-10% |
| 内存增长 | 稳定(无增长) |
| 刷新延迟 | 15-25ms |
| 最大通道数 | 4-6条 |
⚠️ 踩坑预警:
Signal图表存的是数组引用,所以数组不能重新new,只能修改元素值。如果写了_channelBuffers[name] = new double[BUFFER_SIZE],原来的 Signal 图表就和新数组脱钩了,界面不会更新。
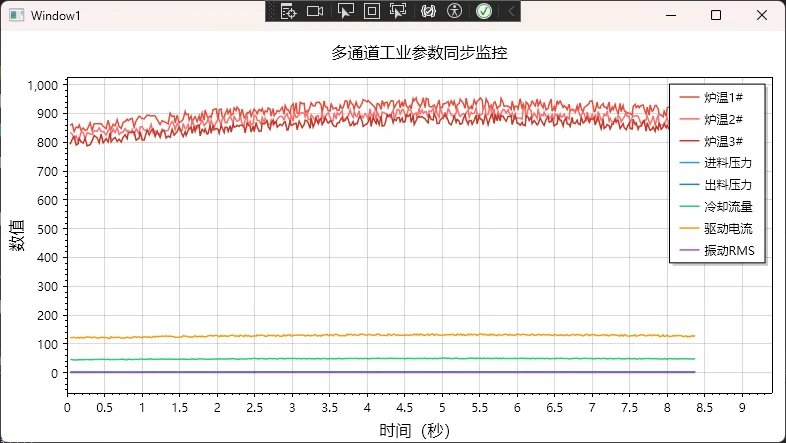
📌 方案二:带时间戳的多通道同步方案(生产级推荐)
适用场景: 通道数 4-8,更新频率 20-50Hz,需要精确时间对齐与滑动窗口显示。
这个方案引入了 ConcurrentQueue 解耦采集与渲染,同时用 SignalXY 支持非均匀时间戳。
csharpusing ScottPlot;
using System;
using System.Collections.Concurrent;
using System.Collections.Generic;
using System.Linq;
using System.Text;
using System.Threading.Tasks;
using System.Windows;
using System.Windows.Controls;
using System.Windows.Data;
using System.Windows.Documents;
using System.Windows.Input;
using System.Windows.Media;
using System.Windows.Media.Imaging;
using System.Windows.Shapes;
using System.Windows.Threading;

namespace AppScottPlot7
{
    /// <summary>
    /// Interaction logic for Window1.xaml
    /// </summary>
    // 传感器数据包:包含时间戳,解决多通道对齐问题
    public record SensorPacket(DateTime Timestamp, string Channel, double Value);

    public partial class Window1 : Window
    {
        // 线程安全队列:生产者-消费者解耦核心
        private readonly ConcurrentQueue<SensorPacket> _dataQueue = new();

        // 每个通道独立维护循环缓冲
        private readonly Dictionary<string, Queue<(double time, double value)>> _channelData = new();
        private readonly Dictionary<string, ScottPlot.Plottables.SignalXY> _signalXYPlots = new();

        private DispatcherTimer _uiTimer;
        private CancellationTokenSource _cts;
        private DateTime _startTime;

        private const int MAX_DISPLAY_SECONDS = 30; // 显示最近30秒
        private const double DISPLAY_TIME_WINDOW = 30.0;

        private readonly (string Name, string Color, double BaseValue)[] _channels =
        {
            ("炉温1#", "#E74C3C", 850),
            ("炉温2#", "#FF6B6B", 820),
            ("炉温3#", "#C0392B", 800),
            ("进料压力", "#3498DB", 2.5),
            ("出料压力", "#2980B9", 1.8),
            ("冷却流量", "#2ECC71", 45),
            ("驱动电流", "#F39C12", 120),
            ("振动RMS", "#9B59B6", 0.8)
        };

        public Window1()
        {
            InitializeComponent();
            _startTime = DateTime.Now;
            InitializeChannels();
            InitializeChart();
            StartAsyncDataCollection();
            StartUIRefresh();
        }

        private void InitializeChannels()
        {
            foreach (var (name, _, _) in _channels)
            {
                _channelData[name] = new Queue<(double, double)>();
            }
        }

        private void InitializeChart()
        {
            var plt = wpfPlot1.Plot;
            plt.Font.Set("Microsoft YaHei");
            plt.Axes.Bottom.Label.FontName = "Microsoft YaHei";
            plt.Axes.Left.Label.FontName = "Microsoft YaHei";

            // 为每个通道创建 SignalXY(支持自定义X时间轴)
            foreach (var (name, color, _) in _channels)
            {
                // 初始化为空数组,后续动态更新
                var plot = plt.Add.SignalXY(
                    new double[] { 0 },
                    new double[] { 0 }
                );
                plot.Color = ScottPlot.Color.FromHex(color);
                plot.LineWidth = 1.5f;
                plot.LegendText = name;
                plot.MarkerSize = 0;

                _signalXYPlots[name] = plot;
            }

            plt.Title("多通道工业参数同步监控");
            plt.XLabel("时间(秒)");
            plt.YLabel("数值");
            plt.Legend.IsVisible = true;
            plt.Legend.Alignment = Alignment.UpperRight;
            plt.Grid.MajorLineColor = ScottPlot.Colors.Gray.WithAlpha(0.3);

            wpfPlot1.Refresh();
        }

        /// <summary>
        /// 后台异步数据采集(模拟真实传感器的非均匀采样)
        /// </summary>
        private void StartAsyncDataCollection()
        {
            _cts = new CancellationTokenSource();

            Task.Run(async () =>
            {
                var random = new Random();

                while (!_cts.Token.IsCancellationRequested)
                {
                    // 模拟各通道采样时间略有差异(真实场景)
                    foreach (var (name, _, baseValue) in _channels)
                    {
                        double noise = (random.NextDouble() - 0.5) * baseValue * 0.05;
                        double cycle = baseValue * 0.1 * Math.Sin(
                            (DateTime.Now - _startTime).TotalSeconds * 0.3);

                        _dataQueue.Enqueue(new SensorPacket(
                            DateTime.Now, name, baseValue + noise + cycle));
                    }

                    // 20ms 间隔 = 50Hz 采样率
                    await Task.Delay(20, _cts.Token);
                }
            }, _cts.Token);
        }

        /// <summary>
        /// UI 刷新定时器:50ms 周期(20Hz刷新率),批量消费数据
        /// </summary>
        private void StartUIRefresh()
        {
            _uiTimer = new DispatcherTimer
            {
                Interval = TimeSpan.FromMilliseconds(50)
            };
            _uiTimer.Tick += OnUIRefresh;
            _uiTimer.Start();
        }

        private void OnUIRefresh(object sender, EventArgs e)
        {
            // 批量消费队列中所有待处理数据
            int processedCount = 0;
            while (_dataQueue.TryDequeue(out var packet) && processedCount < 500)
            {
                double relativeTime = (packet.Timestamp - _startTime).TotalSeconds;

                if (_channelData.TryGetValue(packet.Channel, out var queue))
                {
                    queue.Enqueue((relativeTime, packet.Value));

                    // 滑动窗口:移除超出时间窗口的旧数据
                    double cutoffTime = relativeTime - DISPLAY_TIME_WINDOW;
                    while (queue.Count > 0 && queue.Peek().time < cutoffTime)
                    {
                        queue.Dequeue();
                    }
                }

                processedCount++;
            }

            if (processedCount == 0) return;

            // 更新所有通道的绘图数据
            double currentTime = (DateTime.Now - _startTime).TotalSeconds;

            foreach (var (name, _, _) in _channels)
            {
                if (!_channelData.TryGetValue(name, out var queue) || queue.Count < 2)
                    continue;

                var points = queue.ToArray();
                double[] xData = points.Select(p => p.time).ToArray();
                double[] yData = points.Select(p => p.value).ToArray();

                // 移除旧图表,添加新图表(SignalXY 需要重新创建以更新数据)
                wpfPlot1.Plot.Remove(_signalXYPlots[name]);
                var newPlot = wpfPlot1.Plot.Add.SignalXY(xData, yData);
                newPlot.Color = ScottPlot.Color.FromHex(
                    _channels.First(c => c.Name == name).Color);
                newPlot.LineWidth = 1.5f;
                newPlot.LegendText = name;
                newPlot.MarkerSize = 0;
                _signalXYPlots[name] = newPlot;
            }

            // 滑动X轴窗口
            wpfPlot1.Plot.Axes.SetLimitsX(
                Math.Max(0, currentTime - DISPLAY_TIME_WINDOW),
                currentTime + 1);

            wpfPlot1.Plot.Axes.AutoScaleY();

            // 统一刷新一次——8条曲线共用这一次渲染
            wpfPlot1.Refresh();
        }

        protected override void OnClosed(EventArgs e)
        {
            _cts?.Cancel();
            _uiTimer?.Stop();
            base.OnClosed(e);
        }
    }
}
方案二性能对比(8通道 / 50Hz / 测试环境:i5-10400 / 16GB RAM / .NET 6.0):
| 指标 | 原生Chart | 方案一 | 方案二 |
|---|---|---|---|
| CPU 占用 | 75% | 10% | 12% |
| 内存(30min后) | 2.1GB | 45MB | 62MB |
| 刷新延迟 | 1800ms | 25ms | 28ms |
| 队列积压 | 严重 | 无 | 无 |
⚠️ 踩坑预警:
ConcurrentQueue没有大小限制,如果采集速度长期大于消费速度,队列会无限膨胀。生产环境必须加队列上限,超出时丢弃最旧数据。SignalXY要求 X 数组严格递增,多线程写入时一定要保证时间戳单调性。Refresh()必须在 UI 线程调用,DispatcherTimer的 Tick 回调天然在 UI 线程,无需额外Invoke。
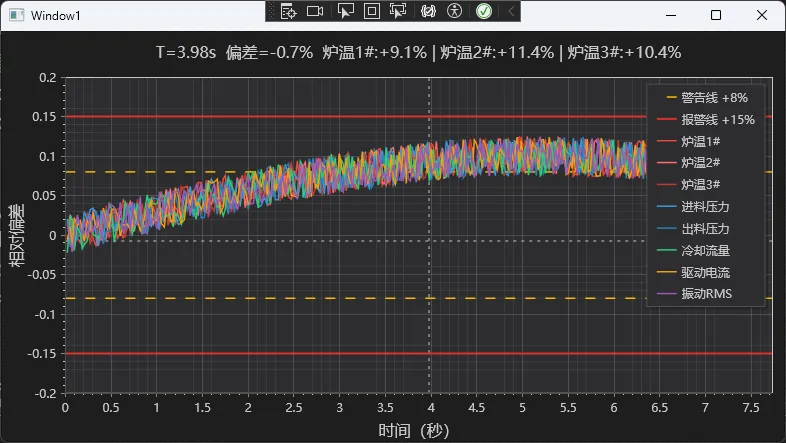
📌 方案三:带暗色工业主题 + 十字光标交互的完整版
适用场景: 生产环境交付,需要符合工业 HMI 规范的专业外观与精确数值读取功能。
在方案二的基础上,加入以下工业级特性:
csharpprivate void ConfigureIndustrialTheme()
{
    var plt = wpfPlot1.Plot;

    // ISA-101 标准暗色主题:减少操作员视觉疲劳
    plt.FigureBackground.Color = new ScottPlot.Color(30, 30, 30);   // #1E1E1E
    plt.DataBackground.Color = new ScottPlot.Color(45, 45, 48);     // #2D2D30

    // 层次化网格:主网格存在但不喧宾夺主
    plt.Grid.MajorLineColor = ScottPlot.Colors.Gray.WithAlpha(100);
    plt.Grid.MajorLineWidth = 1;
    plt.Grid.MinorLineColor = ScottPlot.Colors.Gray.WithAlpha(40);
    plt.Grid.MinorLineWidth = 0.5f;

    // 坐标轴颜色适配暗色主题
    plt.Axes.Color(ScottPlot.Color.FromHex("#C8C8C8"));

    // 图例暗色适配
    plt.Legend.BackgroundColor = ScottPlot.Color.FromHex("#2D2D30");
    plt.Legend.FontColor = ScottPlot.Color.FromHex("#C8C8C8");
    plt.Legend.OutlineColor = ScottPlot.Color.FromHex("#505050");
}

private void InitializeCrosshairTracking()
{
    // 添加十字准线(工业软件标配)
    var crosshair = wpfPlot1.Plot.Add.Crosshair(0, 0);
    crosshair.LineColor = ScottPlot.Color.FromHex("#C8C8C8");
    crosshair.LineWidth = 1f;
    crosshair.LinePattern = LinePattern.Dotted;
    crosshair.IsVisible = false;

    wpfPlot1.MouseMove += (s, e) =>
    {
        var pixel = e.GetPosition(wpfPlot1);
        var location = wpfPlot1.Plot.GetCoordinates(
            (float)pixel.X, (float)pixel.Y);

        crosshair.Position = location;
        crosshair.IsVisible = true;

        // 标题显示当前坐标信息
        wpfPlot1.Plot.Title(
            $"多通道监控 | X: {location.X:F2}s  Y: {location.Y:F2}");

        wpfPlot1.Refresh();
    };

    wpfPlot1.MouseLeave += (s, e) =>
    {
        crosshair.IsVisible = false;
        wpfPlot1.Plot.Title("多通道工业参数同步监控");
        wpfPlot1.Refresh();
    };
}

// 添加报警线(工业场景必备)
private void AddAlarmLines(double warningValue, double criticalValue)
{
    var warningLine = wpfPlot1.Plot.Add.HorizontalLine(warningValue);
    warningLine.Color = ScottPlot.Color.FromHex("#FFB900"); // 工业黄
    warningLine.LineWidth = 1.5f;
    warningLine.LinePattern = LinePattern.Dashed;

    var criticalLine = wpfPlot1.Plot.Add.HorizontalLine(criticalValue);
    criticalLine.Color = ScottPlot.Color.FromHex("#DC322F"); // 报警红
    criticalLine.LineWidth = 2f;
    criticalLine.LinePattern = LinePattern.Solid;
}
📊 性能优化要点总结
经过实战调优,这几条是最管用的:
- 固定 Y 轴范围:
Axes.SetLimitsY()替代AutoScale(),节省约30%计算量 - 批量刷新:多通道只调用一次
Refresh(),而不是每条曲线刷一次 - 控制渲染频率:20Hz(50ms)是肉眼可感知的流畅阈值,超过没有意义
- 关闭抗锯齿(大数据量时):
wpfPlot1.Plot.RenderManager.AntiAliasingLevel = 0 - 队列积压监控:定期检查
_dataQueue.Count,超过阈值时触发降频或丢弃策略
🎯 写在最后
这篇文章从单通道入门,到带时间戳的多通道同步,再到工业级暗色主题,走完了多通道实时监控的完整路径。
三点核心收获:
- 架构比代码更重要:生产者-消费者 + 批量刷新的模式,是所有高频实时场景的万能解法
- 预分配 > 动态分配:固定大小的循环缓冲区,彻底消灭 GC 压力
- 时间戳是多通道同步的灵魂:用绝对时间戳对齐,而不是靠索引对齐
持续学习路线:
- 入门:掌握
Signal/SignalXY/Scatter三种绘图类型的适用场景 - 进阶:研究
DataStreamer内置循环缓冲与RingBuffer实现细节 - 高级:结合
Channel<T>+PeriodicTimer实现真正的生产级异步数据管道
💬 互动话题
-
你们项目里多通道监控最多同时显示几路? 有没有遇到过8路以上的场景,是怎么解决的?
-
实战挑战:尝试在方案二的基础上,增加一个"暂停/恢复"功能——暂停时界面静止但数据继续采集,恢复时一次性补全暂停期间的数据。欢迎评论区贴代码!
如果这篇文章帮你解决了多通道显示的难题,欢迎点赞 + 收藏,转发给同样在做工业软件的朋友。踩过的坑标出来,让后来者少走弯路,这是技术人之间最好的互动方式。
🏷️ 相关标签:#C#开发 #WPF性能优化 #工业数据可视化 #ScottPlot #实时监控 #多线程编程


本文作者:技术老小子
本文链接:
版权声明:本博客所有文章除特别声明外,均采用 BY-NC-SA 许可协议。转载请注明出处!