
Press Ctrl+ and K to search
目录
在日常的Python开发中,我们经常会遇到需要生成PDF文档的场景:自动化报告、数据导出、发票生成、证书制作等。虽然市面上有很多PDF生成库,但对于Windows开发者来说,fpdf库以其轻量级、易上手的特点成为了首选方案。
本文将通过实战案例,带你从零开始掌握fpdf库的使用,解决Python生成PDF的常见问题。无论你是想要生成简单的文本报告,还是制作包含图表、表格的复杂文档,这篇文章都能为你提供完整的解决方案。
🔍 问题分析
为什么选择fpdf?
在Python的PDF生成领域,常见的库有:
- reportlab:功能强大但学习曲线陡峭
- weasyprint:依赖较多,Windows环境配置复杂
- fpdf:纯Python实现,轻量级,API简洁
fpdf的核心优势:
- ✅ 纯Python实现,无需额外依赖
- ✅ API设计简洁,上手快
- ✅ 支持中文字体
- ✅ 内存占用小,性能优异
💡 解决方案
🚀 环境准备
首先安装fpdf库:
Bashpip install fpdf2
注意:建议使用fpdf2而不是原版fpdf,因为fpdf2修复了很多bug并添加了新特性。
🎨 基础使用模式
fpdf的基本使用流程:
Pythonfrom fpdf import FPDF
from fpdf.enums import XPos, YPos

pdf = FPDF()
pdf.add_page()

# 添加宋体字体,需要给一个字体别名,比如 SimSun
pdf.add_font('SimSun', '', r'C:\Windows\Fonts\Dengb.ttf')

# 设置字体为刚添加的宋体
pdf.set_font('SimSun', size=12)

pdf.cell(200, 10, '你好,世界', new_x=XPos.LMARGIN, new_y=YPos.NEXT)

pdf.output('output.pdf')

🔧 代码实战
🧾 表格与多数据源集成
实用场景比如爬虫、数据库数据导出为结构化PDF报表。示例:
Pythonfrom fpdf import FPDF

data = [
    ['姓名', '部门', '得分'],
    ['张三', '开发', '88'],
    ['李四', '测试', '92'],
]

pdf = FPDF()
pdf.add_page()

# 添加字体文件,记得这是字体的绝对路径,确认文件存在
pdf.add_font('SimSun', '', r'C:\Windows\Fonts\Dengb.ttf')

# 设置字体,先调用set_font激活字体
pdf.set_font('SimSun', size=12)

for row in data:
    for item in row:
        pdf.cell(40, 10, item, border=1)
    pdf.ln()

pdf.output('out_table.pdf')

经验之谈:灵活控制cell宽度,可以让PDF表格适配任意项目需求。
完整案例
Python
# -*- coding: utf-8 -*-
from fpdf import FPDF
from fpdf.enums import XPos, YPos
import matplotlib.pyplot as plt
import numpy as np
from datetime import datetime, timedelta
import os
import tempfile
# 设置中文字体支持
plt.rcParams['font.sans-serif'] = ['SimHei', 'DejaVu Sans'] # 用来正常显示中文标签
plt.rcParams['axes.unicode_minus'] = False # 用来正常显示负号
class ManufacturingReportPDF(FPDF):
"""制造业报告PDF生成器"""
def __init__(self):
super().__init__()
self.set_auto_page_break(auto=True, margin=15)
# 添加中文字体支持
self.add_font('SimHei', '', 'C:/Windows/Fonts/Dengb.ttf')
self.add_font('SimHei', 'B', 'C:/Windows/Fonts/Dengb.ttf')
def header(self):
"""页眉"""
self.set_font('SimHei', 'B', 16)
self.cell(0, 10, '制造业生产报告', new_x=XPos.LMARGIN, new_y=YPos.NEXT, align='C')
self.ln(10)
def footer(self):
"""页脚"""
self.set_y(-15)
self.set_font('SimHei', '', 8)
self.cell(0, 10, f'第 {self.page_no()} 页', new_x=XPos.RIGHT, new_y=YPos.TOP, align='C')
def add_title_section(self, title):
"""添加标题部分"""
self.set_font('SimHei', 'B', 14)
self.cell(0, 10, title, new_x=XPos.LMARGIN, new_y=YPos.NEXT, align='L')
self.ln(5)
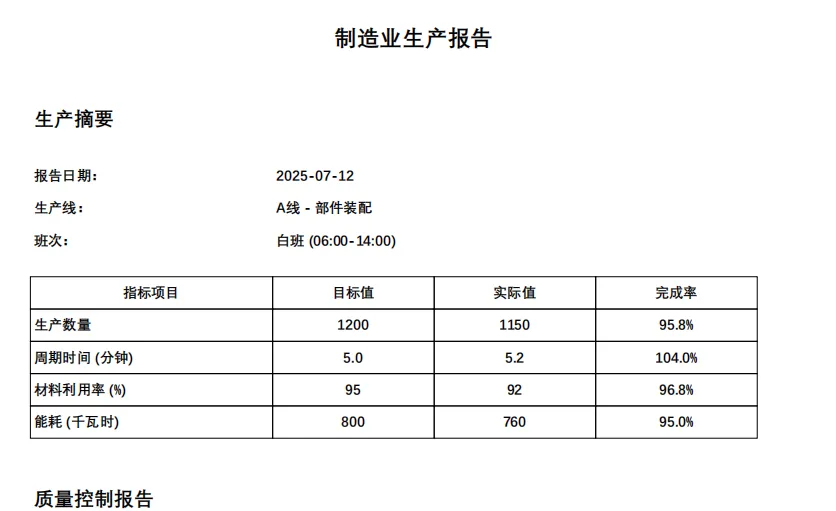
def add_production_summary(self, production_data):
"""添加生产摘要"""
self.add_title_section('生产摘要')
# 基本信息
self.set_font('SimHei', '', 10)
self.cell(60, 8, '报告日期:', new_x=XPos.RIGHT, new_y=YPos.TOP, align='L')
self.cell(60, 8, production_data['report_date'], new_x=XPos.LMARGIN, new_y=YPos.NEXT, align='L')
self.cell(60, 8, '生产线:', new_x=XPos.RIGHT, new_y=YPos.TOP, align='L')
self.cell(60, 8, production_data['production_line'], new_x=XPos.LMARGIN, new_y=YPos.NEXT, align='L')
self.cell(60, 8, '班次:', new_x=XPos.RIGHT, new_y=YPos.TOP, align='L')
self.cell(60, 8, production_data['shift'], new_x=XPos.LMARGIN, new_y=YPos.NEXT, align='L')
self.ln(5)
# 生产指标表格
self.set_font('SimHei', 'B', 10)
self.cell(60, 8, '指标项目', border=1, new_x=XPos.RIGHT, new_y=YPos.TOP, align='C')
self.cell(40, 8, '目标值', border=1, new_x=XPos.RIGHT, new_y=YPos.TOP, align='C')
self.cell(40, 8, '实际值', border=1, new_x=XPos.RIGHT, new_y=YPos.TOP, align='C')
self.cell(40, 8, '完成率', border=1, new_x=XPos.LMARGIN, new_y=YPos.NEXT, align='C')
self.set_font('SimHei', '', 10)
for metric in production_data['metrics']:
self.cell(60, 8, metric['name'], border=1, new_x=XPos.RIGHT, new_y=YPos.TOP, align='L')
self.cell(40, 8, str(metric['target']), border=1, new_x=XPos.RIGHT, new_y=YPos.TOP, align='C')
self.cell(40, 8, str(metric['actual']), border=1, new_x=XPos.RIGHT, new_y=YPos.TOP, align='C')
achievement = f"{(metric['actual'] / metric['target'] * 100):.1f}%"
self.cell(40, 8, achievement, border=1, new_x=XPos.LMARGIN, new_y=YPos.NEXT, align='C')
self.ln(10)
def add_quality_report(self, quality_data):
"""添加质量报告"""
self.add_title_section('质量控制报告')
# 质量检测统计
self.set_font('SimHei', '', 10)
self.cell(60, 8, '检测产品总数:', new_x=XPos.RIGHT, new_y=YPos.TOP, align='L')
self.cell(60, 8, str(quality_data['total_inspected']), new_x=XPos.LMARGIN, new_y=YPos.NEXT, align='L')
self.cell(60, 8, '不合格产品数:', new_x=XPos.RIGHT, new_y=YPos.TOP, align='L')
self.cell(60, 8, str(quality_data['defective']), new_x=XPos.LMARGIN, new_y=YPos.NEXT, align='L')
self.cell(60, 8, '合格率:', new_x=XPos.RIGHT, new_y=YPos.TOP, align='L')
pass_rate = (quality_data['total_inspected'] - quality_data['defective']) / quality_data['total_inspected'] * 100
self.cell(60, 8, f"{pass_rate:.2f}%", new_x=XPos.LMARGIN, new_y=YPos.NEXT, align='L')
self.ln(5)
# 缺陷类型统计
self.set_font('SimHei', 'B', 10)
self.cell(80, 8, '缺陷类型', border=1, new_x=XPos.RIGHT, new_y=YPos.TOP, align='C')
self.cell(40, 8, '数量', border=1, new_x=XPos.RIGHT, new_y=YPos.TOP, align='C')
self.cell(40, 8, '占比', border=1, new_x=XPos.LMARGIN, new_y=YPos.NEXT, align='C')
self.set_font('SimHei', '', 10)
for defect in quality_data['defect_types']:
self.cell(80, 8, defect['type'], border=1, new_x=XPos.RIGHT, new_y=YPos.TOP, align='L')
self.cell(40, 8, str(defect['count']), border=1, new_x=XPos.RIGHT, new_y=YPos.TOP, align='C')
percentage = f"{(defect['count'] / quality_data['defective'] * 100):.1f}%"
self.cell(40, 8, percentage, border=1, new_x=XPos.LMARGIN, new_y=YPos.NEXT, align='C')
self.ln(10)
def add_equipment_status(self, equipment_data):
"""添加设备状态报告"""
self.add_title_section('设备状态报告')
# 设备状态表格
self.set_font('SimHei', 'B', 10)
self.cell(50, 8, '设备名称', border=1, new_x=XPos.RIGHT, new_y=YPos.TOP, align='C')
self.cell(30, 8, '状态', border=1, new_x=XPos.RIGHT, new_y=YPos.TOP, align='C')
self.cell(40, 8, '运行率 (%)', border=1, new_x=XPos.RIGHT, new_y=YPos.TOP, align='C')
self.cell(50, 8, '最后维护日期', border=1, new_x=XPos.LMARGIN, new_y=YPos.NEXT, align='C')
self.set_font('SimHei', '', 10)
for equipment in equipment_data:
self.cell(50, 8, equipment['name'], border=1, new_x=XPos.RIGHT, new_y=YPos.TOP, align='L')
# 状态显示 - 使用颜色区分
if equipment['status'] == '运行中':
self.set_text_color(0, 128, 0) # 绿色
elif equipment['status'] == '维护中':
self.set_text_color(255, 165, 0) # 橙色
else:
self.set_text_color(255, 0, 0) # 红色
self.cell(30, 8, equipment['status'], border=1, new_x=XPos.RIGHT, new_y=YPos.TOP, align='C')
self.set_text_color(0, 0, 0) # 重置为黑色
self.cell(40, 8, f"{equipment['uptime']:.1f}%", border=1, new_x=XPos.RIGHT, new_y=YPos.TOP, align='C')
self.cell(50, 8, equipment['last_maintenance'], border=1, new_x=XPos.LMARGIN, new_y=YPos.NEXT, align='C')
self.ln(10)
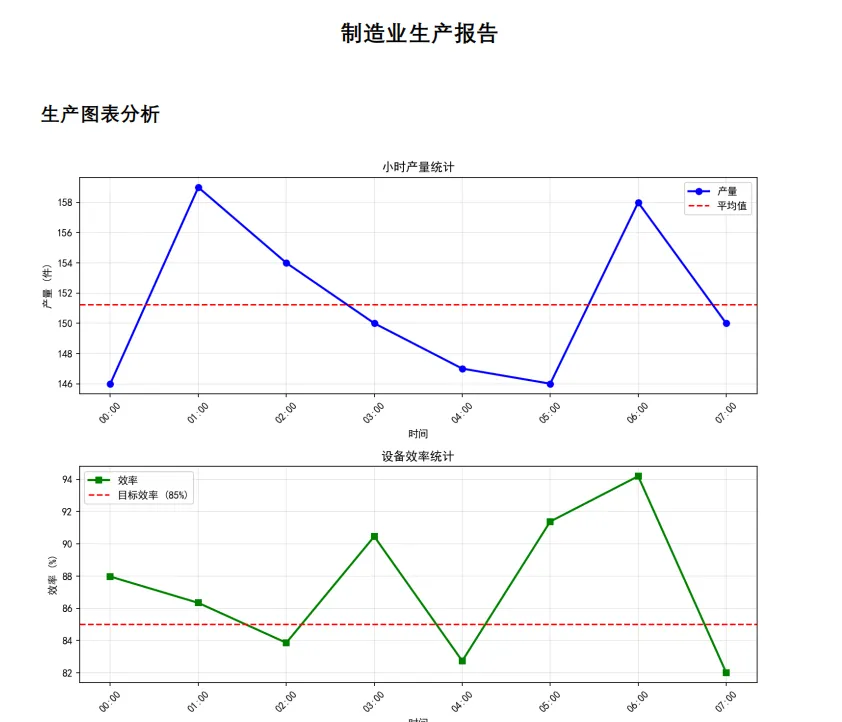
def add_production_chart(self, hourly_data):
"""添加生产图表"""
# 创建临时文件存储图表
with tempfile.NamedTemporaryFile(suffix='.png', delete=False) as tmp:
chart_path = tmp.name
# 生成图表
fig, (ax1, ax2) = plt.subplots(2, 1, figsize=(10, 8))
# 小时产量图
hours = [f'{i:02d}:00' for i in range(len(hourly_data['production']))]
ax1.plot(range(len(hours)), hourly_data['production'], 'b-', marker='o', label='产量', linewidth=2)
ax1.axhline(y=np.mean(hourly_data['production']), color='r', linestyle='--', label='平均值')
ax1.set_xlabel('时间')
ax1.set_ylabel('产量 (件)')
ax1.set_title('小时产量统计')
ax1.legend()
ax1.grid(True, alpha=0.3)
ax1.set_xticks(range(len(hours)))
ax1.set_xticklabels(hours, rotation=45)
# 设备效率图
ax2.plot(range(len(hours)), hourly_data['efficiency'], 'g-', marker='s', label='效率', linewidth=2)
ax2.axhline(y=85, color='r', linestyle='--', label='目标效率 (85%)')
ax2.set_xlabel('时间')
ax2.set_ylabel('效率 (%)')
ax2.set_title('设备效率统计')
ax2.legend()
ax2.grid(True, alpha=0.3)
ax2.set_xticks(range(len(hours)))
ax2.set_xticklabels(hours, rotation=45)
plt.tight_layout()
plt.savefig(chart_path, dpi=150, bbox_inches='tight')
plt.close()
# 添加图表到PDF
self.add_title_section('生产图表分析')
self.image(chart_path, x=10, y=None, w=180)
# 清理临时文件
os.unlink(chart_path)
def generate_manufacturing_report():
"""生成制造业报告PDF"""
# 模拟生产数据
production_data = {
'report_date': datetime.now().strftime('%Y-%m-%d'),
'production_line': 'A线 - 部件装配',
'shift': '白班 (06:00-14:00)',
'metrics': [
{'name': '生产数量', 'target': 1200, 'actual': 1150},
{'name': '周期时间 (分钟)', 'target': 5.0, 'actual': 5.2},
{'name': '材料利用率 (%)', 'target': 95, 'actual': 92},
{'name': '能耗 (千瓦时)', 'target': 800, 'actual': 760}
]
}
quality_data = {
'total_inspected': 1150,
'defective': 23,
'defect_types': [
{'type': '尺寸偏差', 'count': 12},
{'type': '表面缺陷', 'count': 6},
{'type': '装配错误', 'count': 3},
{'type': '材料缺陷', 'count': 2}
]
}
equipment_data = [
{'name': '数控机床 #1', 'status': '运行中', 'uptime': 98.5, 'last_maintenance': '2024-01-15'},
{'name': '装配机器人 #2', 'status': '运行中', 'uptime': 96.2, 'last_maintenance': '2024-01-10'},
{'name': '输送带 #3', 'status': '维护中', 'uptime': 87.3, 'last_maintenance': '2024-01-20'},
{'name': '质检扫描仪 #4', 'status': '运行中', 'uptime': 99.1, 'last_maintenance': '2024-01-12'}
]
# 生成小时数据
np.random.seed(42) # 确保结果可重现
hourly_data = {
'production': np.random.randint(140, 160, 8).tolist(),
'efficiency': np.random.uniform(82, 95, 8).tolist()
}
# 生成PDF报告
pdf = ManufacturingReportPDF()
pdf.add_page()
# 添加各个部分
pdf.add_production_summary(production_data)
pdf.add_quality_report(quality_data)
pdf.add_equipment_status(equipment_data)
pdf.add_production_chart(hourly_data)
# 保存PDF
output_filename = f'制造业生产报告_{datetime.now().strftime("%Y%m%d_%H%M%S")}.pdf'
pdf.output(output_filename)
print(f"制造业报告已生成: {output_filename}")
return output_filename
if __name__ == "__main__":
# 生成报告
try:
report_file = generate_manufacturing_report()
except Exception as e:
print(f"生成报告时出错: {e}")
print("提示:如果字体文件不存在,请确保系统中安装了中文字体,或修改字体路径")
🎯 结尾
通过本篇实战指南,你已掌握了Python开发中fpdf生成PDF的核心技能。回顾三大要点:
- fpdf简单灵活,适用于从上位机数据导出到自动化报表各种场景
- 自定义字体,轻松支持中文,实现高质量排版
- 多元素集成(文本、表格、图片),项目应用快速落地
不论你是致力于提升编程技巧的新手,还是追求效率的项目开发者,都可以将上述方法直接运用。欢迎留言讨论,未来还会带来更多基于Python开发的实用技巧和上位机开发最佳实践!
本文作者:技术老小子
本文链接:
版权声明:本博客所有文章除特别声明外,均采用 BY-NC-SA 许可协议。转载请注明出处!
目录