
目录
Python PDF Generation Practical Guide: fpdf Library Makes Document Creation Simple
In daily Python development, we frequently encounter scenarios where PDF document generation is required: automated reports, data exports, invoice generation, certificate creation, etc. While there are many PDF generation libraries available, for Windows developers, the fpdf library has become the preferred solution due to its lightweight and easy-to-use characteristics.
This article will guide you from zero to mastering the fpdf library through practical cases, solving common problems in Python PDF generation. Whether you want to generate simple text reports or create complex documents containing charts and tables, this article can provide you with complete solutions.
🔍 Problem Analysis
Why Choose fpdf?
In the Python PDF generation field, common libraries include:
- reportlab: Powerful but steep learning curve
- weasyprint: Many dependencies, complex configuration in Windows environment
- fpdf: Pure Python implementation, lightweight, concise API
Core advantages of fpdf:
- ✅ Pure Python implementation, no additional dependencies required
- ✅ Simple API design, quick to learn
- ✅ Supports Chinese fonts
- ✅ Low memory usage, excellent performance
💡 Solution
🚀 Environment Setup
First install the fpdf library:
Bashpip install fpdf2
Note: It's recommended to use fpdf2 instead of the original fpdf, as fpdf2 has fixed many bugs and added new features.
🎨 Basic Usage Pattern
Basic fpdf usage workflow:
Pythonfrom fpdf import FPDF
from fpdf.enums import XPos, YPos

pdf = FPDF()
pdf.add_page()

# Add SimSun font, need to provide a font alias, e.g., SimSun
pdf.add_font('SimSun', '', r'C:\Windows\Fonts\Dengb.ttf')

# Set font to the newly added SimSun
pdf.set_font('SimSun', size=12)

pdf.cell(200, 10, 'Hello, World', new_x=XPos.LMARGIN, new_y=YPos.NEXT)

pdf.output('output.pdf')

🔧 Code Practice
🧾 Tables and Multi-Data Source Integration
Practical scenarios like web scraping, database data export to structured PDF reports. Example:
Pythonfrom fpdf import FPDF

data = [
    ['Name', 'Department', 'Score'],
    ['John', 'Development', '88'],
    ['Jane', 'Testing', '92'],
]

pdf = FPDF()
pdf.add_page()

# Add font file, remember this is the absolute path of the font, confirm the file exists
pdf.add_font('SimSun', '', r'C:\Windows\Fonts\Dengb.ttf')

# Set font, call set_font first to activate the font
pdf.set_font('SimSun', size=12)

for row in data:
    for item in row:
        pdf.cell(40, 10, item, border=1)
    pdf.ln()

pdf.output('out_table.pdf')

Experience tip: Flexibly controlling cell width can make PDF tables adapt to any project requirements.
Complete Case
Python
# -*- coding: utf-8 -*-
from fpdf import FPDF
from fpdf.enums import XPos, YPos
import matplotlib.pyplot as plt
import numpy as np
from datetime import datetime, timedelta
import os
import tempfile
# Set Chinese font support
plt.rcParams['font.sans-serif'] = ['SimHei', 'DejaVu Sans'] # Used to display Chinese labels normally
plt.rcParams['axes.unicode_minus'] = False # Used to display negative signs normally
class ManufacturingReportPDF(FPDF):
"""Manufacturing Report PDF Generator"""
def __init__(self):
super().__init__()
self.set_auto_page_break(auto=True, margin=15)
# Add Chinese font support
self.add_font('SimHei', '', 'C:/Windows/Fonts/Dengb.ttf')
self.add_font('SimHei', 'B', 'C:/Windows/Fonts/Dengb.ttf')
def header(self):
"""Header"""
self.set_font('SimHei', 'B', 16)
self.cell(0, 10, 'Manufacturing Production Report', new_x=XPos.LMARGIN, new_y=YPos.NEXT, align='C')
self.ln(10)
def footer(self):
"""Footer"""
self.set_y(-15)
self.set_font('SimHei', '', 8)
self.cell(0, 10, f'Page {self.page_no()}', new_x=XPos.RIGHT, new_y=YPos.TOP, align='C')
def add_title_section(self, title):
"""Add title section"""
self.set_font('SimHei', 'B', 14)
self.cell(0, 10, title, new_x=XPos.LMARGIN, new_y=YPos.NEXT, align='L')
self.ln(5)
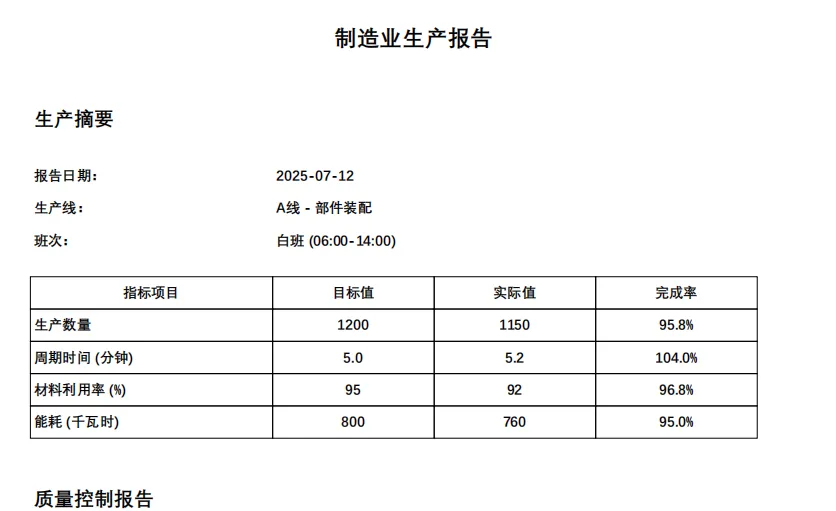
def add_production_summary(self, production_data):
"""Add production summary"""
self.add_title_section('Production Summary')
# Basic information
self.set_font('SimHei', '', 10)
self.cell(60, 8, 'Report Date:', new_x=XPos.RIGHT, new_y=YPos.TOP, align='L')
self.cell(60, 8, production_data['report_date'], new_x=XPos.LMARGIN, new_y=YPos.NEXT, align='L')
self.cell(60, 8, 'Production Line:', new_x=XPos.RIGHT, new_y=YPos.TOP, align='L')
self.cell(60, 8, production_data['production_line'], new_x=XPos.LMARGIN, new_y=YPos.NEXT, align='L')
self.cell(60, 8, 'Shift:', new_x=XPos.RIGHT, new_y=YPos.TOP, align='L')
self.cell(60, 8, production_data['shift'], new_x=XPos.LMARGIN, new_y=YPos.NEXT, align='L')
self.ln(5)
# Production metrics table
self.set_font('SimHei', 'B', 10)
self.cell(60, 8, 'Metric Item', border=1, new_x=XPos.RIGHT, new_y=YPos.TOP, align='C')
self.cell(40, 8, 'Target', border=1, new_x=XPos.RIGHT, new_y=YPos.TOP, align='C')
self.cell(40, 8, 'Actual', border=1, new_x=XPos.RIGHT, new_y=YPos.TOP, align='C')
self.cell(40, 8, 'Achievement', border=1, new_x=XPos.LMARGIN, new_y=YPos.NEXT, align='C')
self.set_font('SimHei', '', 10)
for metric in production_data['metrics']:
self.cell(60, 8, metric['name'], border=1, new_x=XPos.RIGHT, new_y=YPos.TOP, align='L')
self.cell(40, 8, str(metric['target']), border=1, new_x=XPos.RIGHT, new_y=YPos.TOP, align='C')
self.cell(40, 8, str(metric['actual']), border=1, new_x=XPos.RIGHT, new_y=YPos.TOP, align='C')
achievement = f"{(metric['actual'] / metric['target'] * 100):.1f}%"
self.cell(40, 8, achievement, border=1, new_x=XPos.LMARGIN, new_y=YPos.NEXT, align='C')
self.ln(10)
def add_quality_report(self, quality_data):
"""Add quality report"""
self.add_title_section('Quality Control Report')
# Quality inspection statistics
self.set_font('SimHei', '', 10)
self.cell(60, 8, 'Total Inspected:', new_x=XPos.RIGHT, new_y=YPos.TOP, align='L')
self.cell(60, 8, str(quality_data['total_inspected']), new_x=XPos.LMARGIN, new_y=YPos.NEXT, align='L')
self.cell(60, 8, 'Defective Products:', new_x=XPos.RIGHT, new_y=YPos.TOP, align='L')
self.cell(60, 8, str(quality_data['defective']), new_x=XPos.LMARGIN, new_y=YPos.NEXT, align='L')
self.cell(60, 8, 'Pass Rate:', new_x=XPos.RIGHT, new_y=YPos.TOP, align='L')
pass_rate = (quality_data['total_inspected'] - quality_data['defective']) / quality_data['total_inspected'] * 100
self.cell(60, 8, f"{pass_rate:.2f}%", new_x=XPos.LMARGIN, new_y=YPos.NEXT, align='L')
self.ln(5)
# Defect type statistics
self.set_font('SimHei', 'B', 10)
self.cell(80, 8, 'Defect Type', border=1, new_x=XPos.RIGHT, new_y=YPos.TOP, align='C')
self.cell(40, 8, 'Count', border=1, new_x=XPos.RIGHT, new_y=YPos.TOP, align='C')
self.cell(40, 8, 'Percentage', border=1, new_x=XPos.LMARGIN, new_y=YPos.NEXT, align='C')
self.set_font('SimHei', '', 10)
for defect in quality_data['defect_types']:
self.cell(80, 8, defect['type'], border=1, new_x=XPos.RIGHT, new_y=YPos.TOP, align='L')
self.cell(40, 8, str(defect['count']), border=1, new_x=XPos.RIGHT, new_y=YPos.TOP, align='C')
percentage = f"{(defect['count'] / quality_data['defective'] * 100):.1f}%"
self.cell(40, 8, percentage, border=1, new_x=XPos.LMARGIN, new_y=YPos.NEXT, align='C')
self.ln(10)
def add_equipment_status(self, equipment_data):
"""Add equipment status report"""
self.add_title_section('Equipment Status Report')
# Equipment status table
self.set_font('SimHei', 'B', 10)
self.cell(50, 8, 'Equipment Name', border=1, new_x=XPos.RIGHT, new_y=YPos.TOP, align='C')
self.cell(30, 8, 'Status', border=1, new_x=XPos.RIGHT, new_y=YPos.TOP, align='C')
self.cell(40, 8, 'Uptime (%)', border=1, new_x=XPos.RIGHT, new_y=YPos.TOP, align='C')
self.cell(50, 8, 'Last Maintenance', border=1, new_x=XPos.LMARGIN, new_y=YPos.NEXT, align='C')
self.set_font('SimHei', '', 10)
for equipment in equipment_data:
self.cell(50, 8, equipment['name'], border=1, new_x=XPos.RIGHT, new_y=YPos.TOP, align='L')
# Status display - use color differentiation
if equipment['status'] == 'Running':
self.set_text_color(0, 128, 0) # Green
elif equipment['status'] == 'Maintenance':
self.set_text_color(255, 165, 0) # Orange
else:
self.set_text_color(255, 0, 0) # Red
self.cell(30, 8, equipment['status'], border=1, new_x=XPos.RIGHT, new_y=YPos.TOP, align='C')
self.set_text_color(0, 0, 0) # Reset to black
self.cell(40, 8, f"{equipment['uptime']:.1f}%", border=1, new_x=XPos.RIGHT, new_y=YPos.TOP, align='C')
self.cell(50, 8, equipment['last_maintenance'], border=1, new_x=XPos.LMARGIN, new_y=YPos.NEXT, align='C')
self.ln(10)
def add_production_chart(self, hourly_data):
"""Add production chart"""
# Create temporary file to store chart
with tempfile.NamedTemporaryFile(suffix='.png', delete=False) as tmp:
chart_path = tmp.name
# Generate chart
fig, (ax1, ax2) = plt.subplots(2, 1, figsize=(10, 8))
# Hourly production chart
hours = [f'{i:02d}:00' for i in range(len(hourly_data['production']))]
ax1.plot(range(len(hours)), hourly_data['production'], 'b-', marker='o', label='Production', linewidth=2)
ax1.axhline(y=np.mean(hourly_data['production']), color='r', linestyle='--', label='Average')
ax1.set_xlabel('Time')
ax1.set_ylabel('Production (units)')
ax1.set_title('Hourly Production Statistics')
ax1.legend()
ax1.grid(True, alpha=0.3)
ax1.set_xticks(range(len(hours)))
ax1.set_xticklabels(hours, rotation=45)
# Equipment efficiency chart
ax2.plot(range(len(hours)), hourly_data['efficiency'], 'g-', marker='s', label='Efficiency', linewidth=2)
ax2.axhline(y=85, color='r', linestyle='--', label='Target Efficiency (85%)')
ax2.set_xlabel('Time')
ax2.set_ylabel('Efficiency (%)')
ax2.set_title('Equipment Efficiency Statistics')
ax2.legend()
ax2.grid(True, alpha=0.3)
ax2.set_xticks(range(len(hours)))
ax2.set_xticklabels(hours, rotation=45)
plt.tight_layout()
plt.savefig(chart_path, dpi=150, bbox_inches='tight')
plt.close()
# Add chart to PDF
self.add_title_section('Production Chart Analysis')
self.image(chart_path, x=10, y=None, w=180)
# Clean up temporary file
os.unlink(chart_path)
def generate_manufacturing_report():
"""Generate manufacturing report PDF"""
# Simulate production data
production_data = {
'report_date': datetime.now().strftime('%Y-%m-%d'),
'production_line': 'Line A - Component Assembly',
'shift': 'Day Shift (06:00-14:00)',
'metrics': [
{'name': 'Production Quantity', 'target': 1200, 'actual': 1150},
{'name': 'Cycle Time (minutes)', 'target': 5.0, 'actual': 5.2},
{'name': 'Material Utilization (%)', 'target': 95, 'actual': 92},
{'name': 'Energy Consumption (kWh)', 'target': 800, 'actual': 760}
]
}
quality_data = {
'total_inspected': 1150,
'defective': 23,
'defect_types': [
{'type': 'Dimensional Deviation', 'count': 12},
{'type': 'Surface Defects', 'count': 6},
{'type': 'Assembly Errors', 'count': 3},
{'type': 'Material Defects', 'count': 2}
]
}
equipment_data = [
{'name': 'CNC Machine #1', 'status': 'Running', 'uptime': 98.5, 'last_maintenance': '2024-01-15'},
{'name': 'Assembly Robot #2', 'status': 'Running', 'uptime': 96.2, 'last_maintenance': '2024-01-10'},
{'name': 'Conveyor Belt #3', 'status': 'Maintenance', 'uptime': 87.3, 'last_maintenance': '2024-01-20'},
{'name': 'Quality Scanner #4', 'status': 'Running', 'uptime': 99.1, 'last_maintenance': '2024-01-12'}
]
# Generate hourly data
np.random.seed(42) # Ensure reproducible results
hourly_data = {
'production': np.random.randint(140, 160, 8).tolist(),
'efficiency': np.random.uniform(82, 95, 8).tolist()
}
# Generate PDF report
pdf = ManufacturingReportPDF()
pdf.add_page()
# Add each section
pdf.add_production_summary(production_data)
pdf.add_quality_report(quality_data)
pdf.add_equipment_status(equipment_data)
pdf.add_production_chart(hourly_data)
# Save PDF
output_filename = f'Manufacturing_Production_Report_{datetime.now().strftime("%Y%m%d_%H%M%S")}.pdf'
pdf.output(output_filename)
print(f"Manufacturing report generated: {output_filename}")
return output_filename
if __name__ == "__main__":
# Generate report
try:
report_file = generate_manufacturing_report()
except Exception as e:
print(f"Error generating report: {e}")
print("Tip: If font file doesn't exist, please ensure Chinese fonts are installed on the system, or modify the font path")
🎯 Conclusion
Through this practical guide, you have mastered the core skills of generating PDFs with fpdf in Python development. Reviewing the three key points:
- fpdf is simple and flexible, suitable for various scenarios from host computer data export to automated reporting
- Custom fonts, easy Chinese support, achieving high-quality typesetting
- Multi-element integration (text, tables, images), quick project implementation
Whether you are a beginner committed to improving programming skills or a project developer pursuing efficiency, you can directly apply the above methods. Welcome to leave comments for discussion. In the future, more practical tips based on Python development and best practices for host computer development will be brought to you!
本文作者:技术老小子
本文链接:
版权声明:本博客所有文章除特别声明外,均采用 BY-NC-SA 许可协议。转载请注明出处!